In technical analysis wedges are the most powerful trading chart patterns and having very high success ratios.
In this article I will explain the chart pattern wedges and the insight of the chart pattern, how to trade the wedges with live examples and how to find out the stop loss and targets. Wedges are both continuation chart pattern and reversal chart pattern.
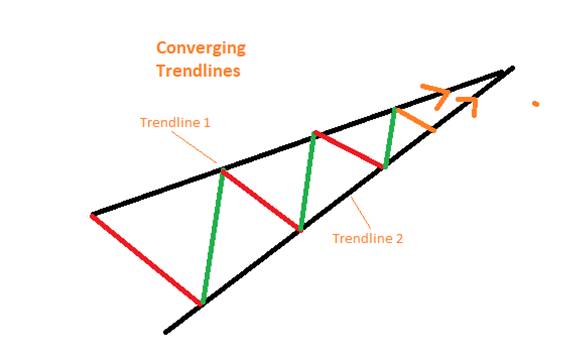
Let us first understand the term wedges in technical analysis – A wedge is a price pattern formed by the two trend lines which are converging to each other. Both the trend lines move in a same direction and at one point they converge each other. In this pattern the two trend lines are drawn to connect the respective highs and lows of a price over a course of 20 to 50 periods.
There are 2 technical patterns in Wedges which are listed as below
- Raising Wedge
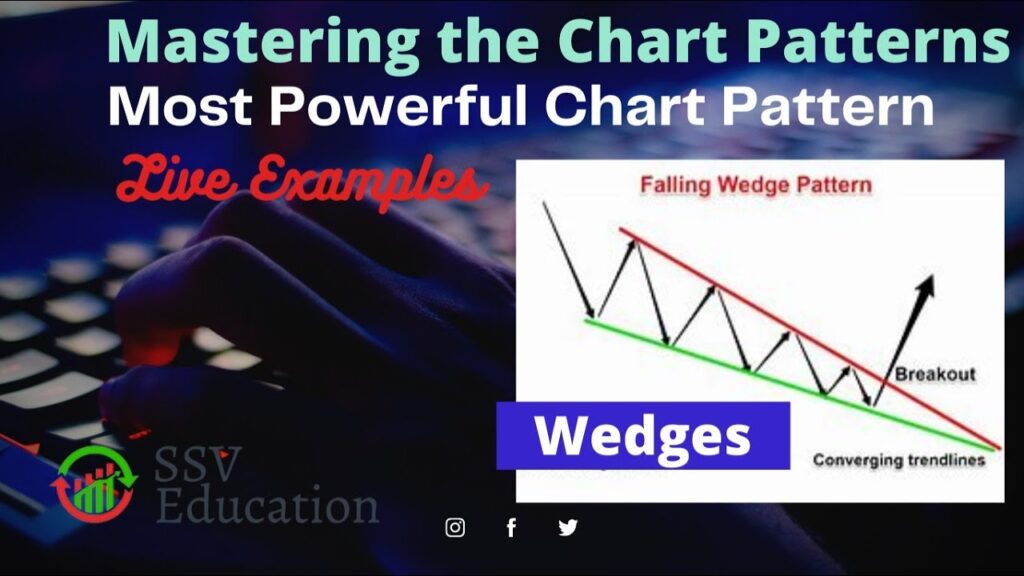
- Falling Wedge
Let’s have a look at how the wedges pattern looks like

The above wedge patterns act as a trend reversal chart pattern and trend continuation chart patterns.
Trend Reversal Chart Pattern
- Raising Wedge formed in an uptrend – Bullish to Bearish Trend Indication
- Falling Wedge formed in a down trend market. – Bearish to Bullish Trend Indication
Trend Continuation Pattern
- Falling Wedge in a rising markets – Continuation of Bullish Trend – Bullish Indication.
- Raising Wedge in a falling markets – Continuation of Bearish Trend – Bearish Indication.
So let us discuss the above chart patterns one by one
Raising Wedge Pattern: – A rising wedge pattern formation in an up trend is an indication that their is a possible trend reversal and is a bearish signal. Rising wedge formation and price break out through lower trend line gives confirmation that the price trend is now changed from bullish to bearish and one can initiate a sell trade or can expect the price to move lower.
Now let us have a look at the example of rising wedge formation in a below technical chart

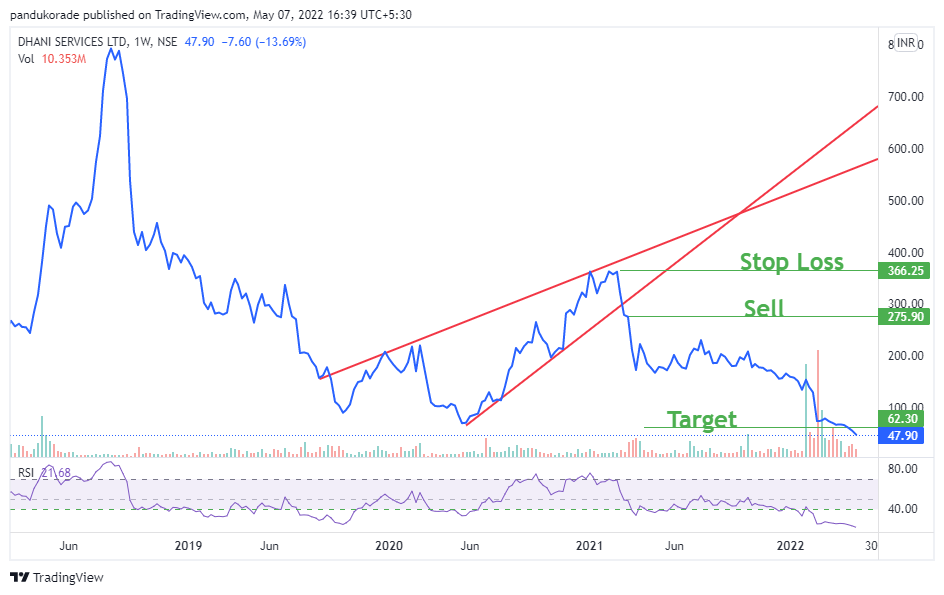
Above chart of Dhani Services is classic example of rising wedge in falling markets which signals the continuation of bearish trend in the stock price.


Now an excellent example of Mindtree technical chart where in you can see three wedges marked in 1, 2 & 3. First wedge formation seen in an uptrend where the stock price of Mindtree given a bearish signal and subsequently after trend reversal wedge 2 & wedge 3 formations in which rising wedge formed in a falling market and continued the bearish trend.
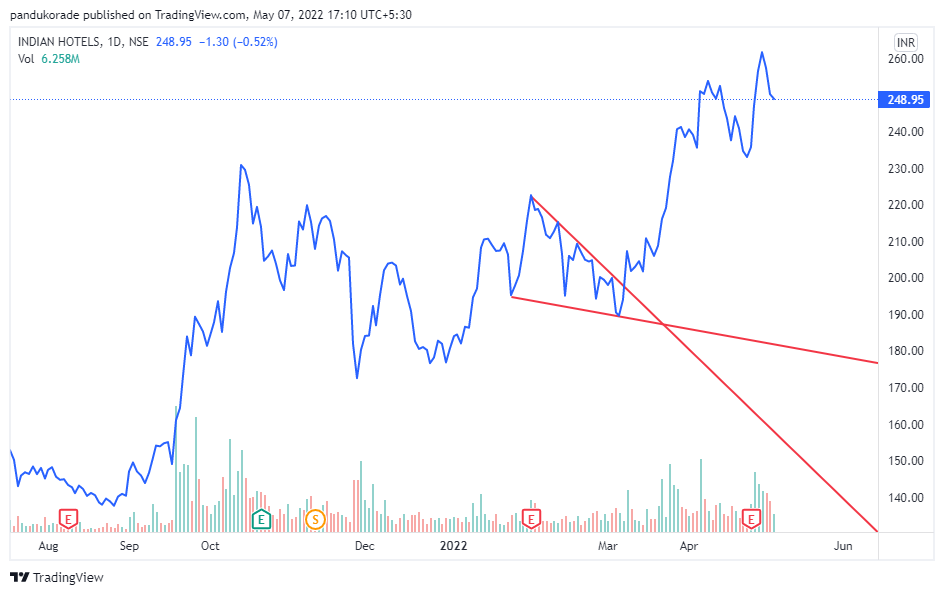
Now let us have a look at the above example of falling wedge in a rising markets of Indian Hotels stock, after formation of falling wedge the stock given a break out and given a move in the direction of a trend. So this is how the wedge patterns are working.
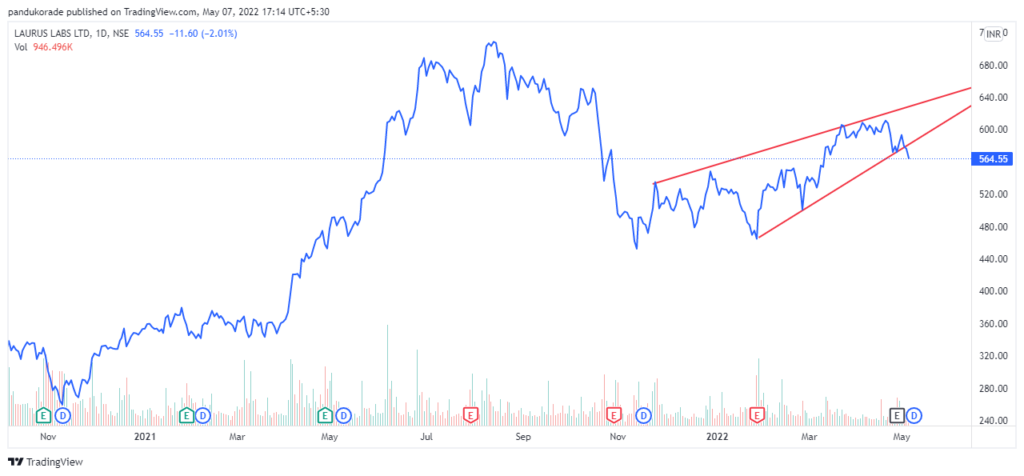
One more example of rising wedge in a falling market of Laurus Labs where in the stock is in a down trend and rising wedge formed and the stock break out towards the down side & we can expect minimum target of around 460 in a stock price of Laurus labs as it is a live example and the lower end of the trend line just broke out at the sell price here comes to 570 with SL at 610.
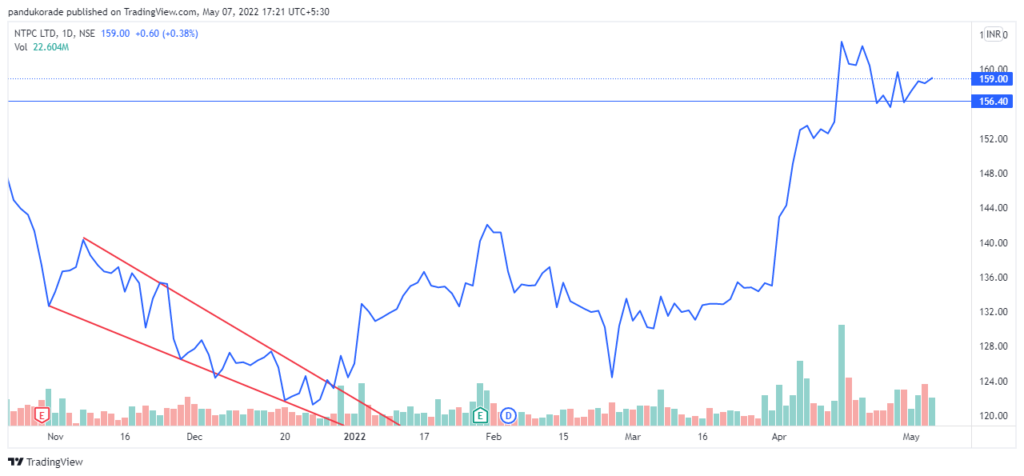
Now also have a look at the above chart of NTPC where in we have seen a falling wedge in a falling market and after breakout the trend reversal in the stock price of NTPC is seen.
Now one more example of falling wedge in a rising markets where in we have seen break out through upper trend line and the stock momentum is continued in the direction of the markets and in further the chart is live and we can expect further upside in the stock price with stop loss at 1990.
So now from the above explanations and examples you might have understood the technical chart pattern wedges and how to trade these wedge patterns. Further you can go through the below video for further clarity in the trading the most powerful trading chart pattern called wedges.
Category: Education – Technical Analysis – Chart Patterns – Trading with Wedges Tags – secrete of making money, trading chart patterns, trading wedges, trading with rising wedges, trading with falling wedges, powerful trading patterns, powerful technical trading patterns, live examples of wedges, live examples of trading wedges, making money from trading, trading with most powerful chart patterns, falling wedge pattern, understanding falling wedge pattern, rising wedge pattern, understanding rising wedge pattern, technical analysis for beginners, stock market for beginners.