Corona Virus India Highlights
- 16.73 crores people in India vaccinated as on of 7th May 2021.
- New Covid-19 Cases Reported on 7th May 2021 – 4,01,078 & 7 Days Average 3,89,672.
- More states opt for lockdown as India’s Covid-19 situation worsen. This week Tamil Nadu, Karnataka, Kerala, Rajasthan & Bihar announced lockdowns and the states like Maharashtra, Chhattisgarh, Delhi, Odisha are already announced lockdown earlier.
- Severe crisis of medical oxygen in Tamil Nadu as per the news reports as on 7th May 2021.
- Several trains which includes Rajdhanis, Shatabdis from Delhi are cancelled due to increase in Covid-19 cases and lower occupancy.


Nifty Prediction for Next Week, Nifty Overview, Nifty Options Chain Analysis (10th to 14th May 2021)
Last week we have seen Nifty rallied from 14416 (low) to 14863 (high) and the nifty is still under consolidation and moving in a channel. Nifty closed at 14863 levels with a positive bias.

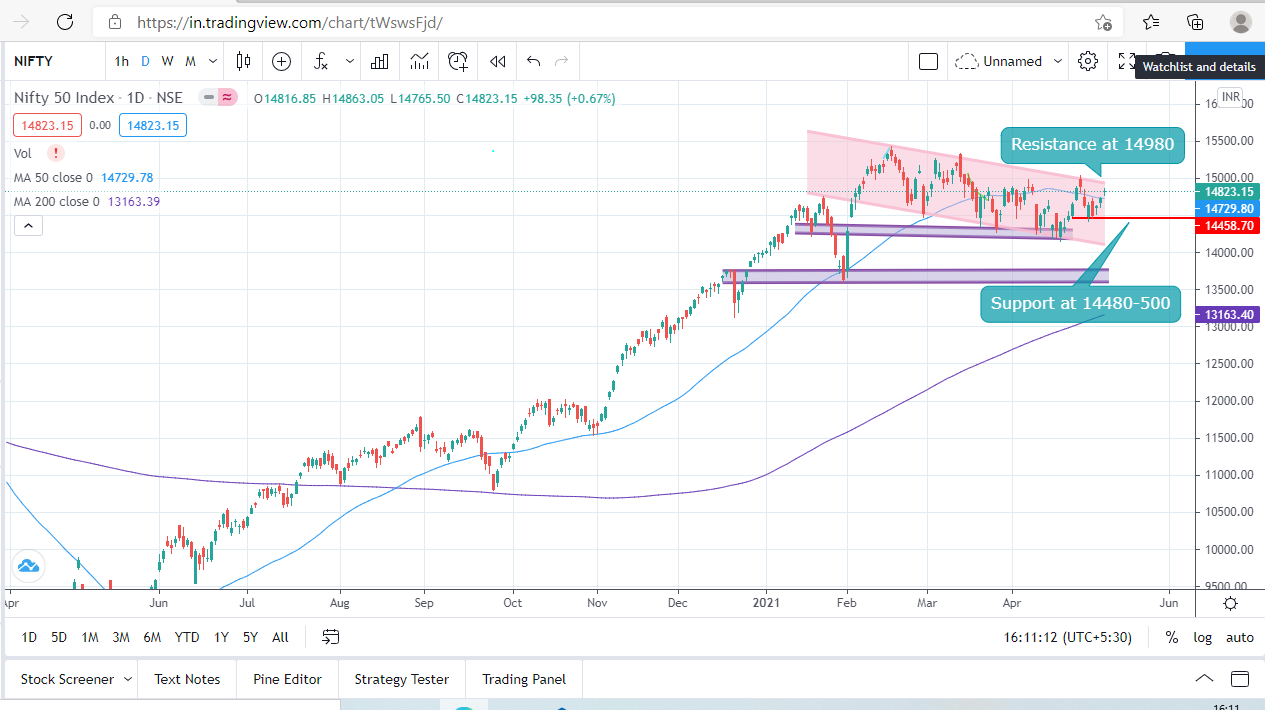
Let’s have a look at above Technical Charts of Nifty, Form the charts, we can analyze that Nifty is consolidating in the pink color channel and the resistance zone is upper end of the channel that is arround 14980 – 15000 levels and support is coming towards 14480-14500 kind of zone. The present move and pattern on the technical chart is indicating the Nifty biased in positive direction and for breakout needs to close above 15000 levels. Fresh trend will resume once nifty break and sustain above 15000 mark whereas break below 14480-14500 zone we can see the downward move toward 14150-140000 levels. .


Nifty Options Chain Analysis
From the Options Chain Data refer the options chain below in the table it looks like 14600 & 14500 are the key support areas, going forward we may not see the nifty below 14500 in next week.
Key Support – 14500

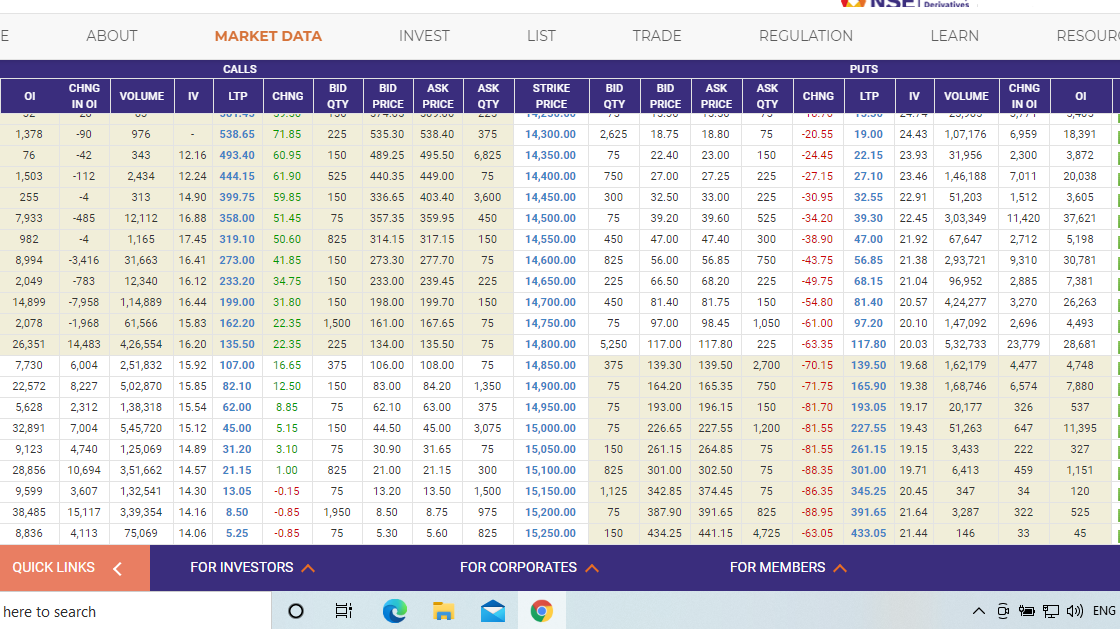
However on the resistance we can see the resistance at 15000 & 15200 levels. Break above one level we can expect the next levels.
Key Resistance – 15000
Bank Nifty Analysis , Banknifty Prediction for Next Week (10th to 14th May 2021).
As explained during the last week market outlook bank nifty formed double bottom and bank nifty holding above 32000 levels and so last week bank nifty consolidated in 1000 points range in a week.

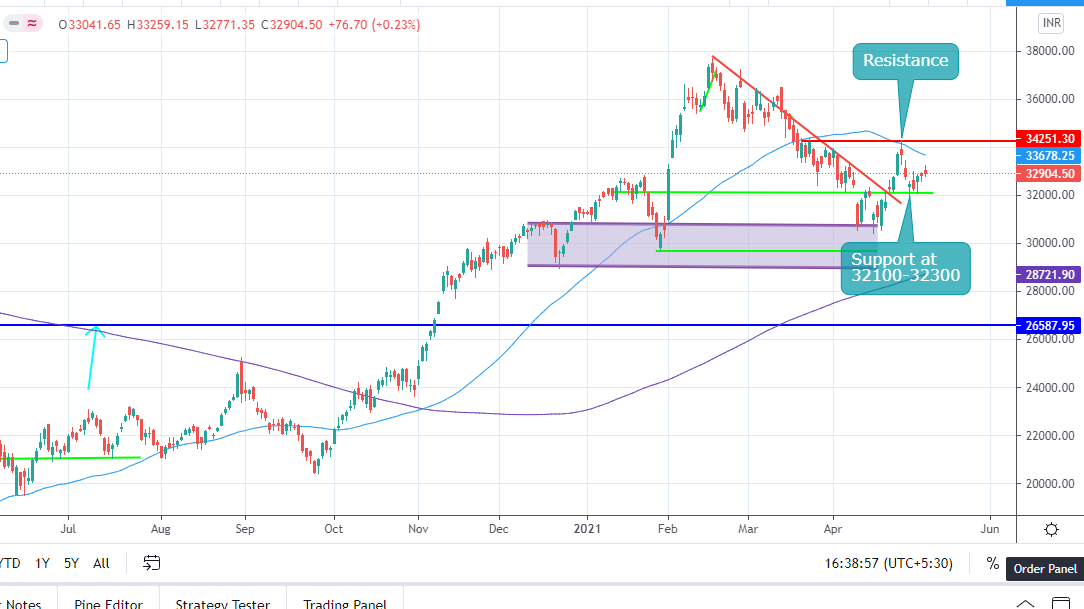
Banknifty present close is at 32904 and now the key area of support is 32100-32300 and if it violates the same then we can see further downside towards 30500 however resistance comes at 33000 and once crossed 33000 we might face resistance at 34250 levels.
Bank Nifty Option Chain Analysis

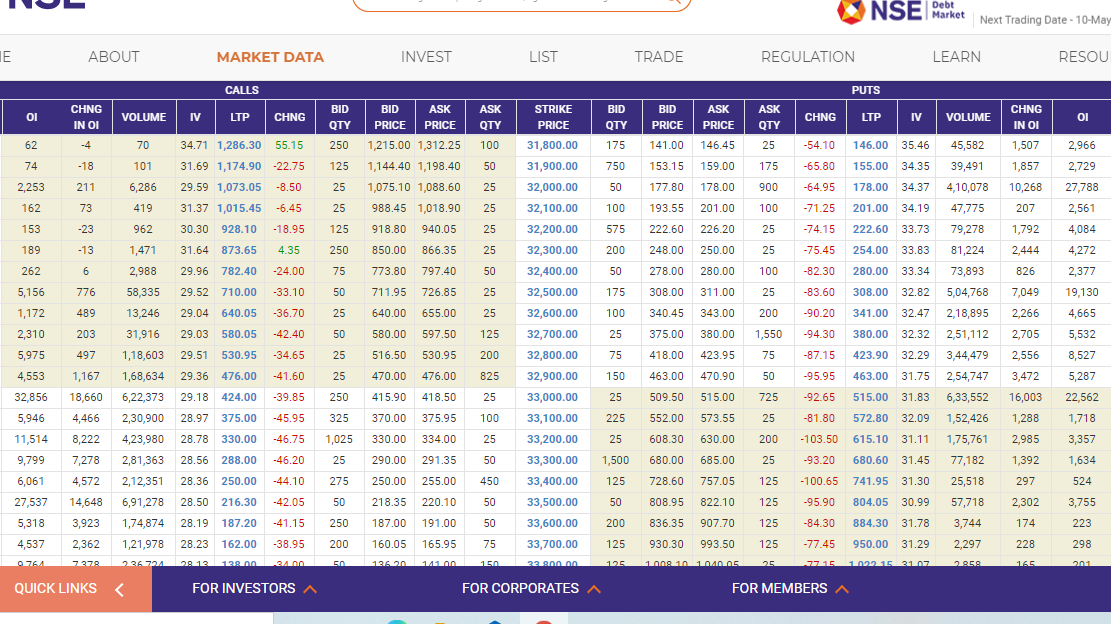
Key Support – 33000 & 32500
Key Resistance at – 33000 , 33500 & 34000
So from the Option Chain Analysis we have to keep in mind the levels as derived from the derivative data.
Stocks to keep on Radar (Stocks can have potential to became multibagger form current levels)
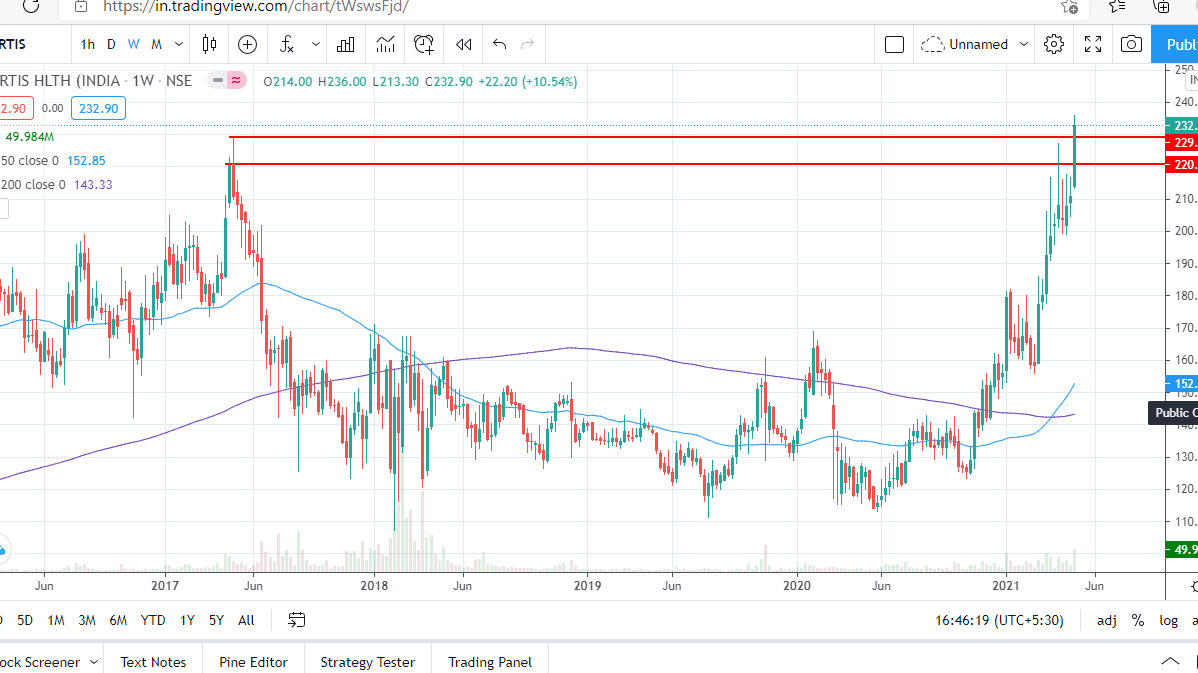
Fortis Healthcare
Fortis Healthcare given a strong breakout on weekly charts above 220 levels and closed at 332.90 & we can expect a rally in Fortis Healthcare in the upcoming weeks.


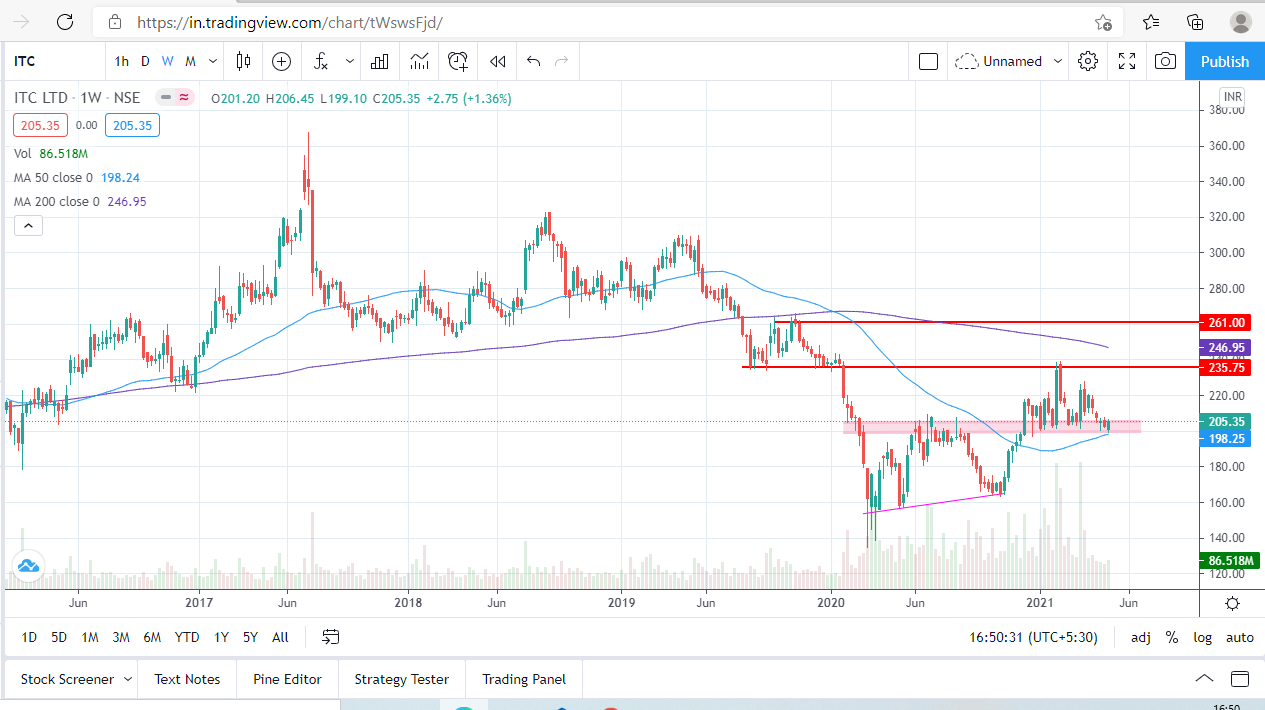
ITC
ITC base formation done at 200 levels and traders and short term investors can look for 235 levels with a stop loss below 198 and once 235 is taken out we can expect 260 levels.
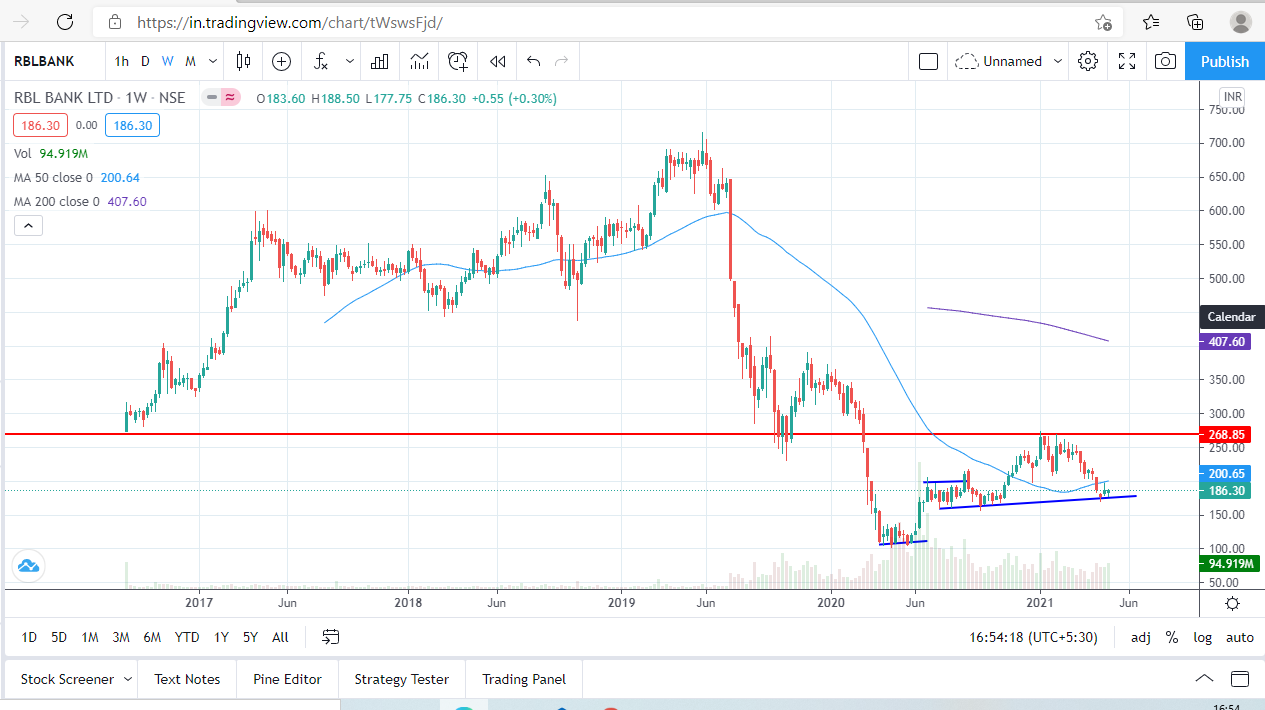
RBL Bank
RBL bank looks like good contra bet for buying around 180-185 levels and can give move towards 269 levels, stop loss for this trade can be placed below 170.

Disclaimer : – The contents posted here are only for Educational purpose and not a buying or selling recommendations, do consult your financial advisor before taking any decision.