Second Wave of Covid-19 and Restrictions Imposed to curtain Covid-19 In India
- India Sets New Global Corona Virus Record
- First lot of Sputnik V vaccines arrives from Russia
- Joe Biden restricts travel from India to US due to Covid-19 outbreak
- New Covid-19 Cases Reported on 30th April 2021 – 4,01,993 & 7 Days Average 3,64,927.
- Most of the states planning to extend the lockdown for 10 to 15th of May 2021
- Center Govt is expected to impose strict restrictions from 4th May 2021.
- Vaccination Drive for 18 years and above to break the chain, vaccine manufactures to increase production and also import of vaccines started in India which could help to break the chain
- Oxygen Shortages – Hopefully Indian Govt and State Govt will put all out efforts in resolving Oxygen supply and infrastructure needs issues.
- New ICU Beds, Need of Doctors, Nurses – Going forward looks like a critical issue and major focus of Govt is required in this area.
- Indian Army initiatives for making Covid-19 Hospitals with Army Doctors and staff with full-fledged facilities will help to accommodate some of the cases.


Nifty Prediction for Next Week, Nifty Overview, Nifty Options Chain Analysis (3rd to 7th May 2021)
Last week we have seen Nifty rallied from 14421 to 15044 amid short covering before the expiry of April series and again after making a high of 15044 which has became a resistance zone corrected and closed at 14631 levels.

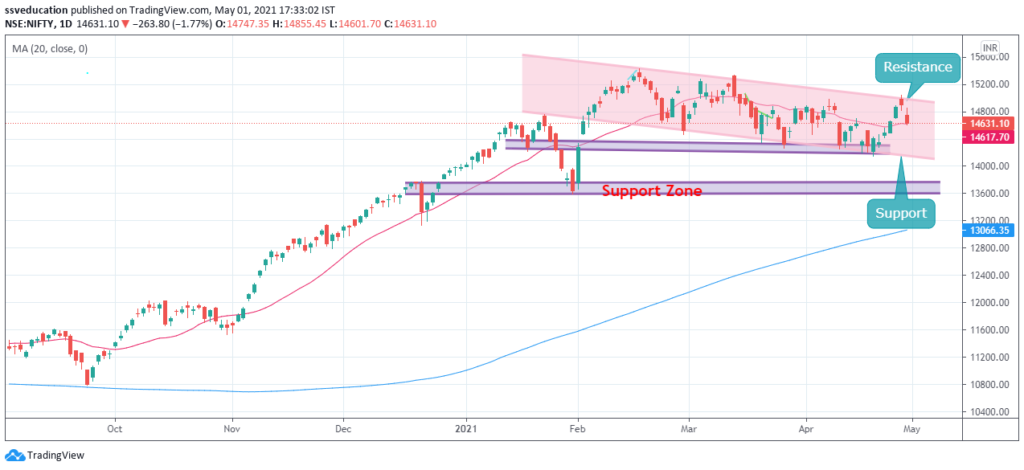
Let’s have a look at above Technical Charts of Nifty, Form the charts, we can analyze that Nifty is consolidating in the pink color channel and the resistance zone is upper end of the channel that is arround 15000 levels and support is coming towards 14200-14150 kind of zone. The present move and pattern on the technical chart is indicating the Nifty direction towards the downward support zone of the channel. Fresh trend will resume once nifty break and sustain above 15000 mark whereas break below 14150-14000 zone we can see the downward move toward 13600-700 levels. .


Open Free Trading and Demat Account Click Here
Nifty Options Chain Analysis
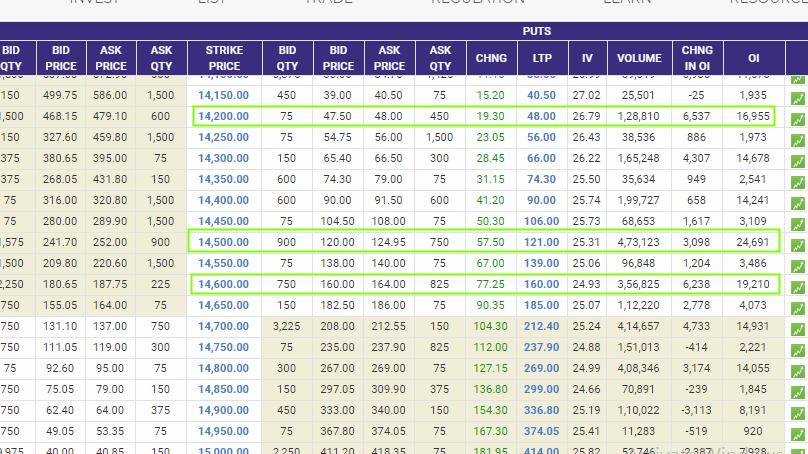
From the Options Chain Data refer the options chain below in the table it looks like 14500 is the key support area followed by 14200 and 14000.
Key Support – 14500


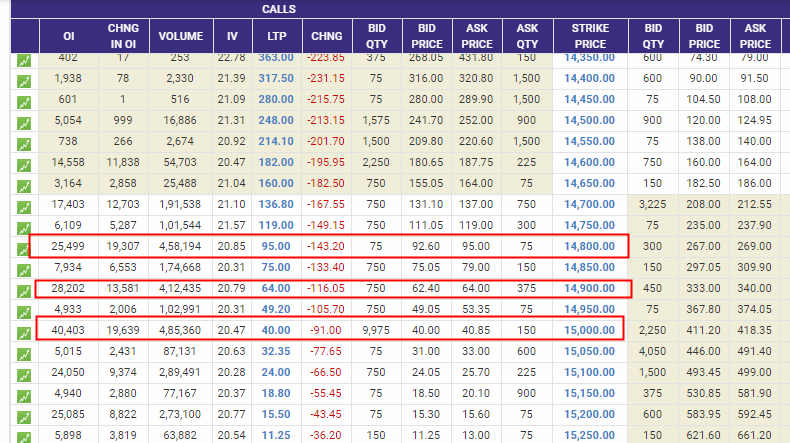
However on the resistance we can see the resistance at 14800-14900 & 15000 levels. Break above one level we can expect the next levels.
Key Resistance – 15000
Bank Nifty Analysis , Banknifty Prediction for Next Week (3rd to 7th May 2021).
Banknifty recovered sharply after making a low of 30550 and also looks like double bottom formation, if banknifty holds above 32300 levels and reverse towards upward direction then we can say that banknifty has formed short term double bottom.

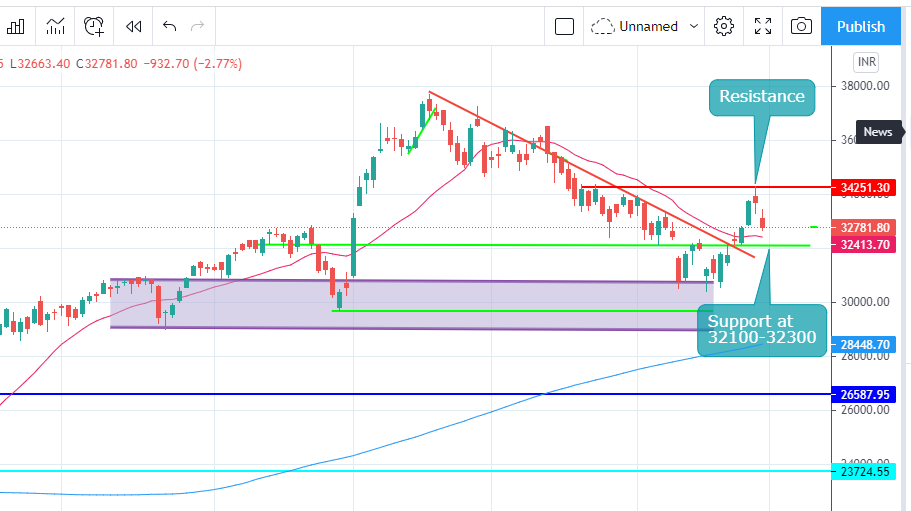
Banknifty present close is at 32781 and now the key area of support is 32100-32300 and if it violates the same then we can see further downside towards 30500 however resistance comes at 33000 and once crossed 33000 we might face resistance at 34250 levels.
Bank Nifty Option Chain Analysis

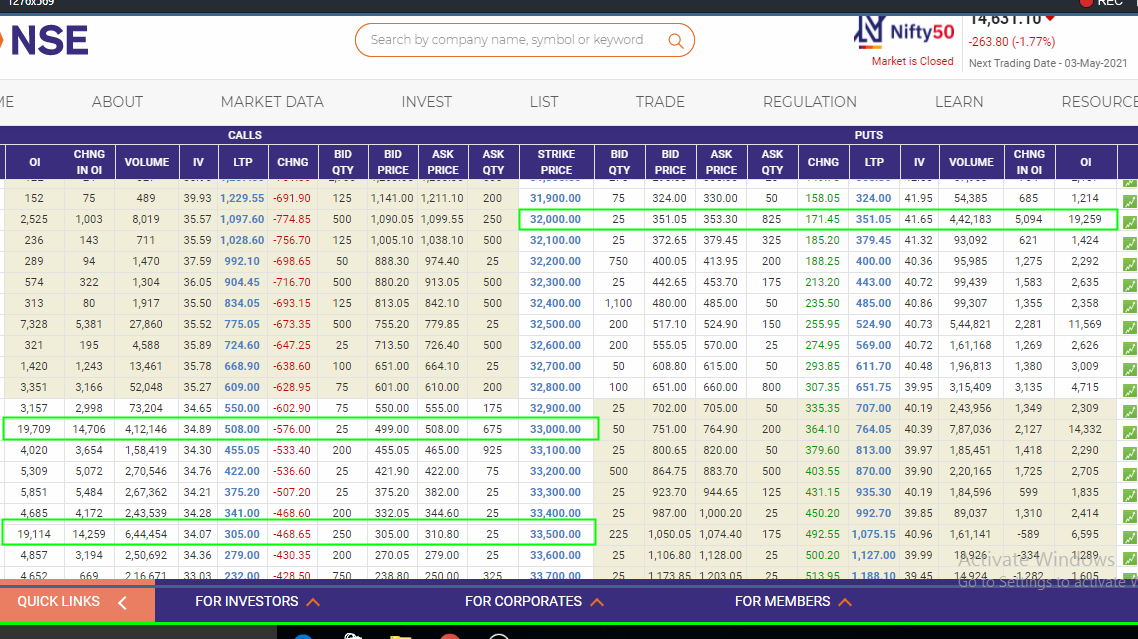
Key Support – 32000
Key Resistance at – 33500 & 34000
So from the Option Chain Analysis we have to keep in mind the levels as derived from the derivative data.
Stocks to keep on Radar (Stocks can have potential to became multibagger form current levels)
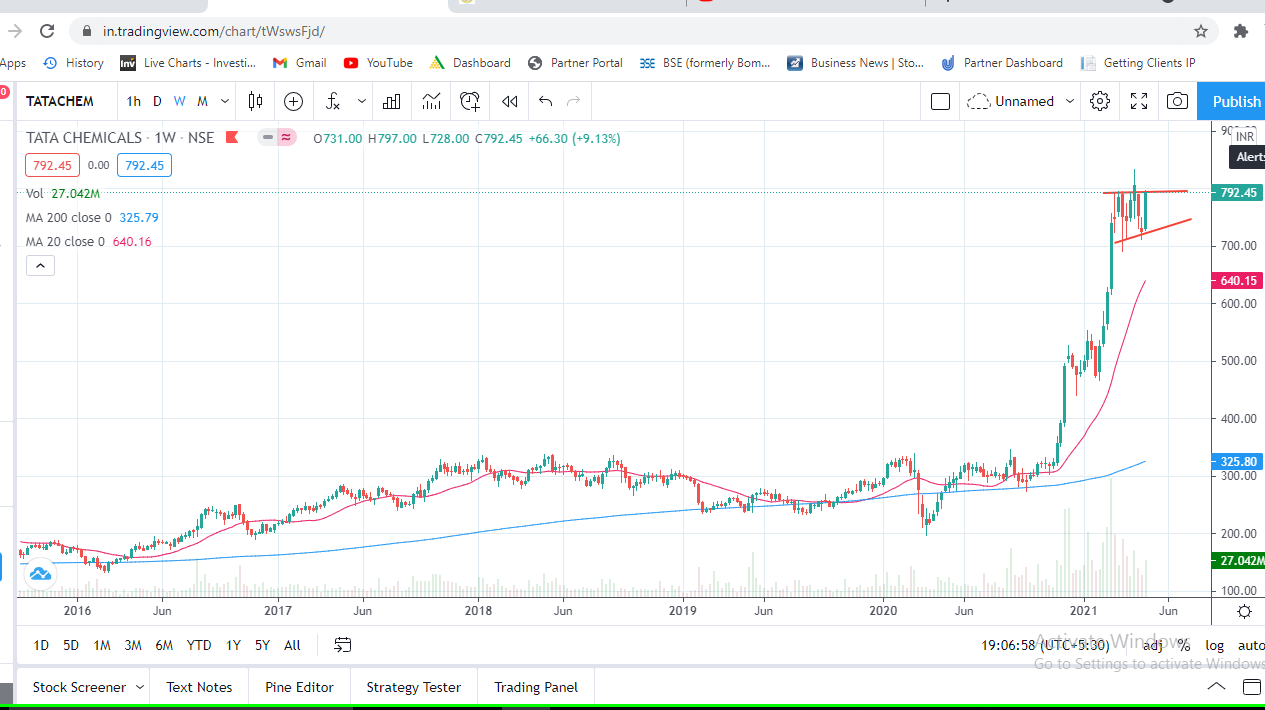
Tata Chemicals
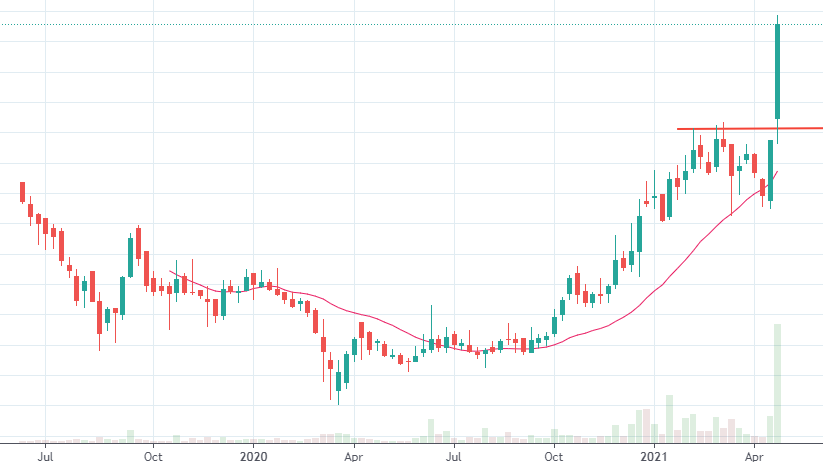
Refer the below technical chart of Tata Chemicals – Over a weekly time frame you can see the stock is in a vertical rally and it is expected to continue the rally so one can prefer to buying this stock at CMP with the lower band marked as a stop loss and we can expect the stock movement in 4 digits in coming weeks. Strong Price Action on the Tata Chemicals Stock


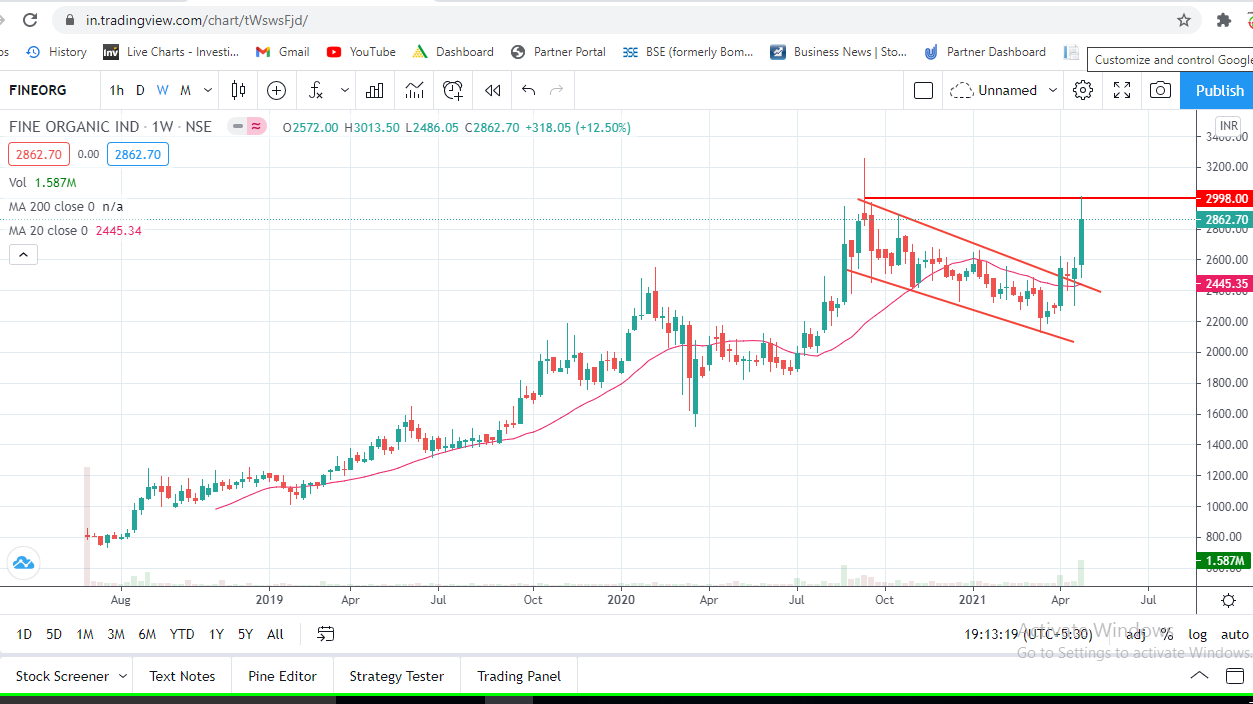
Fine Organics
Look at the below technical chart of Fine Organics and the stock has give breakout out of the downward sloping channel and is now ready for making new highs the stock is good to accumulate at CMP and on every dips which can give us descent returns in the coming months.

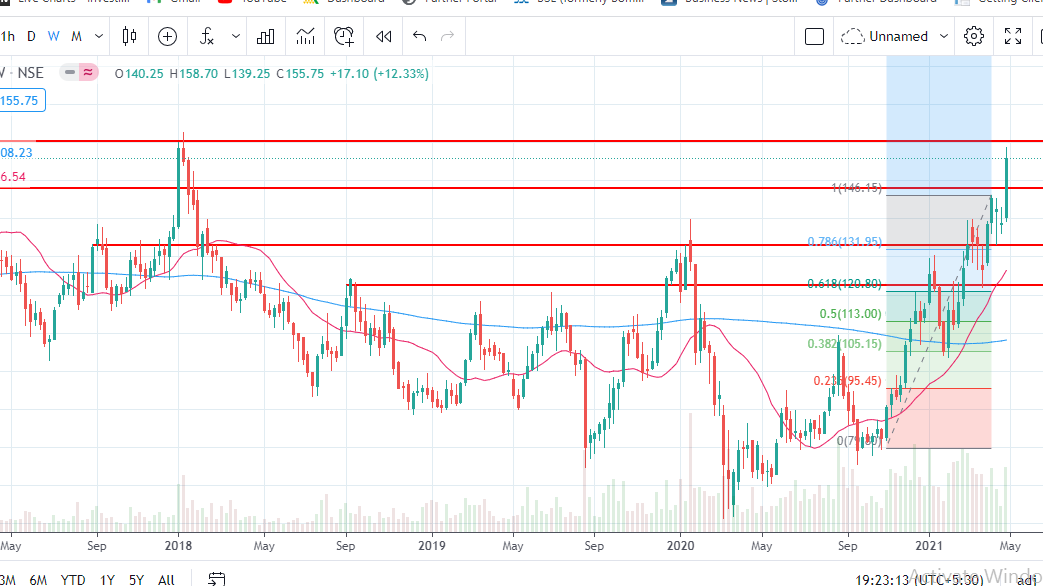
NMDC
Multi Year break out chart NMDC, you can see the weekly chart of NMDC as below and the strong breakout levels are marked on the chart by horizontal lines. Going forward we can expect a strong movement in the NMDC stock and the analysis of the stock you can also refer to the video pasted below the chart for your kind reference.


Disclaimer : – The contents posted here are only for Educational purpose and not a buying or selling recommendations, do consult your financial advisor before taking any decision.

Confidence Petro
Refer the weekly chart below where in you can see the strong breakout in the confidence petro stock which came out from 48-49 levels to close at 62.30 levels. This stock is showing strength in the falling market and hence can be looked into for buying opportunity on every dips and we can expect the stock to move in triple digit figure in upcoming months.