

This section is very much useful for a Beginner level traders or a pro trader as we are going to discuss the candlestick pattern as well as how to trade these candlestick patterns. A beginner trader can understand, how Expert traders use Candlestick patterns to take their trading & investment decisions using these candlestick patterns? At the end of this section you will be able to take trading decisions using the Candlestick patterns & will be able to predict the movement of stock or index or any asset.
Candlestick for short term
Candlestick pattern main funda is that the candlesticks are directly related with Traders emotions and you need to understand the relation of market price, as the candle stick formation base is price. This market price behavior on candlesticks was first understood by Japanese Homma in the 17th Century & from there the funda of candlesticks was adapted in Stock markets. Share market has the relationship between the supply & demand with price, as like the investors emotions are having the same relationship with the Candlestick patterns. By using the candlestick patterns you can better predict the short term price fluctuations. If you are an intraday trader then the understanding and proper use of Candlesticks patterns plays very important role. Now we will understand the formation of Candlestick pattern and how to predict price behavior / movement using the candlestick pattern in details going ahead
Candlestick Patterns Decoded

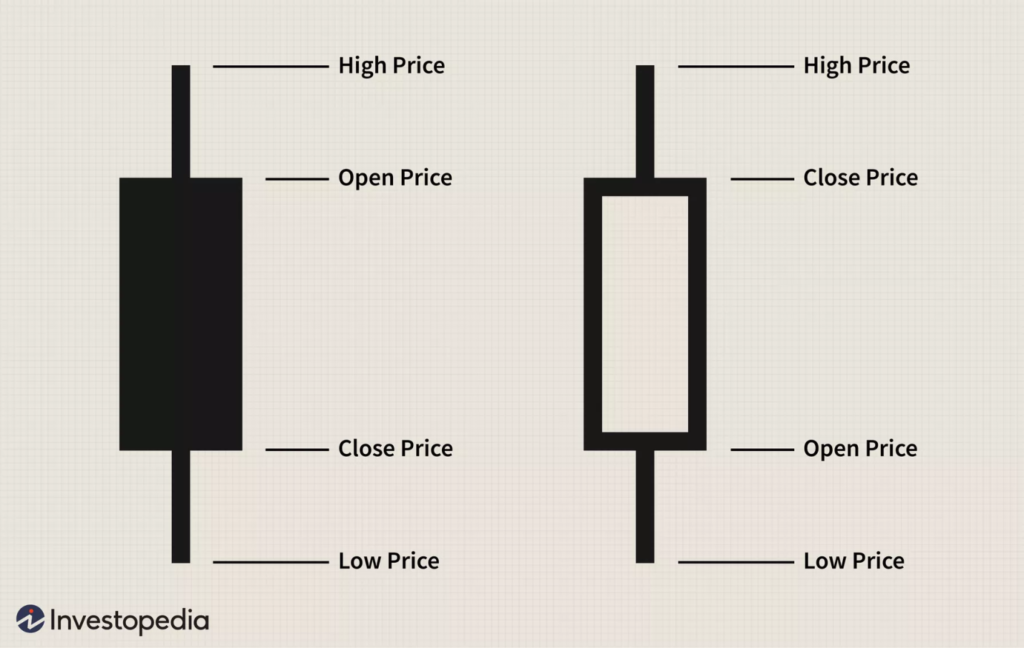
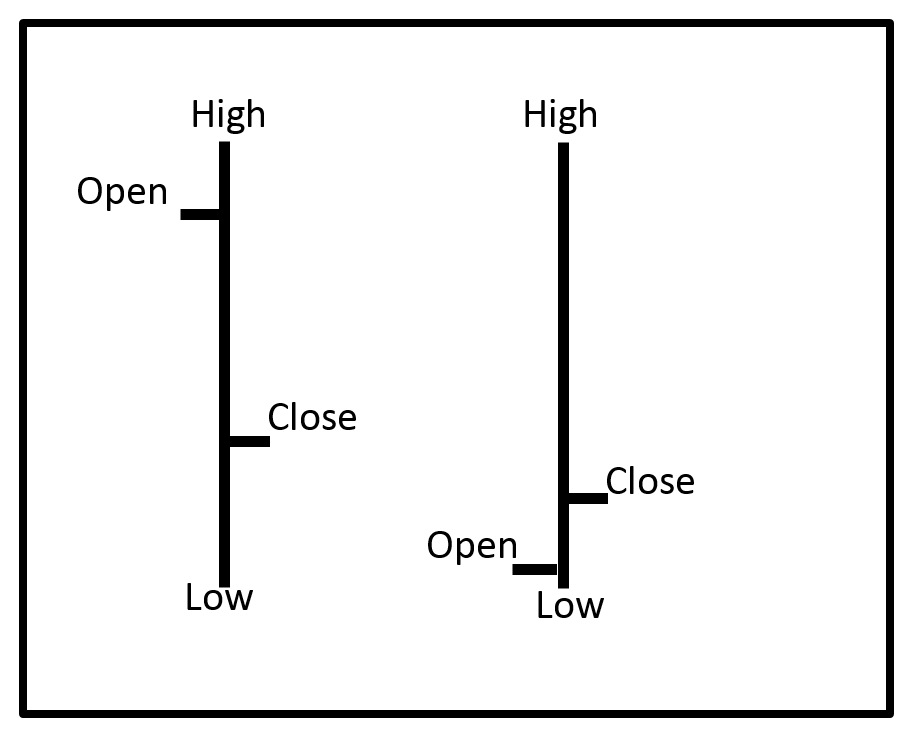
Every candlestick pattern has 4 components which include the price High, Low, Open and Close Value. The middle portion of the Candlestick is called real body & is formed between the open and close price. Now understand the Real Body when you see dark / red then the price closes down from the opening price and it’s called down candle or a bearish candle likewise when the price closes higher then it is called up candle or a bullish candle and the color of the body is black / green / blue. The upper straight line of the body shows high price and the lower straight line shows low price of that candle. Now coming to the Black and white colors shown in the above representations of the candle the colors of the real body varies with different trading software’s / brokers platforms and most widely black or red colors are used to represent down candles which is bearish in nature and white , green or blue colors are used for up candles which is bullish in nature.
The straight line above or below the real body are called shadows or wicks in Candle patterns. Must remember the shadows or wicks length can vary, it can became a smaller or longer according to the price move.
- Now if you see a small shadow on the upper side of the body it means the price is very close to the starting price (opening price) of the day in case of bearish candle or very to close to closing price in case of bullish candle .
- When the lower shadow becomes smaller in length it means the opening price (bullish candle) is very close to the starting price or open price and in case of bearish candle it’s very close to the close price of the day.

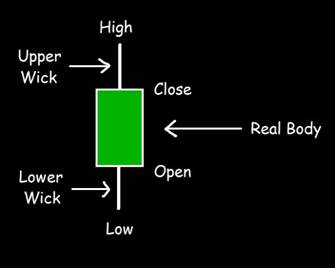
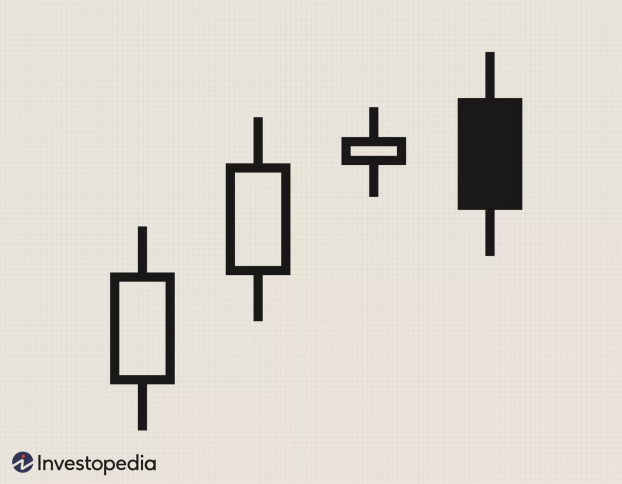
Example of Bullish Candle

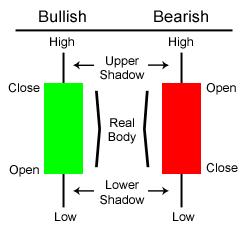
Examples of Bullish and Bearish Candles
Bar Charts vs. Candlestick charts
As like candlestick chart patterns you can also come across bar charts and it’s almost available in every trading software / broker’s platform. Both the Bar charts and candle charts represents and made up from the same price data however candlestick patterns are more effective if you see visually it means you are able to get more insights from the candlesticks compare with the bar charts. The short terms price predictions are better compare with the bar charts and the candlesticks formations are done form the price move of that particular day or interval.

Form the above you can very well understand the visual difference between the bar chart and the candlestick charts.
Now we will under the bearish and bullish candlesticks chart patterns one by one
Bearish Engulfing Pattern


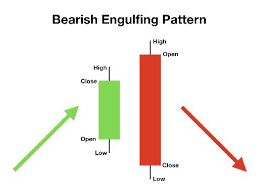
A bearish engulfing candlestick pattern is a combination of two candles, the black or red candlestick that closes lower than the previous day’s close after opening higher than the previous day’s close. It can be identified when a small green candlestick, showing a bullish trend, is followed the next day by a large black candlestick, showing a bearish trend, the real body of which completely overlaps or engulfs the body of the previous day’s candlestick.
Bullish Engulfing Pattern


A bullish engulfing pattern is a green candlestick that closes higher than the previous day’s opening after opening lower than the previous day’s close. It can be identified when a small red candlestick, showing a bearish trend, is followed the next day by a large green candlestick, showing a bullish trend, the body of which completely overlaps or engulfs the body of the previous day’s candlestick.
Bearish Evening Star


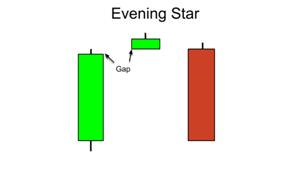
Evening star candlesticks is a combination of 3 candles pattern in which the middle candle closes higher than the first and the last candle and the same you can view from the candlestick patterns shown as above, The first candle remains the green the middle candle may be green of red but definitely closes higher from the previous candle and the next candle closes lower. This type of candlestick pattern formation is bearish in nature and can became a trend reversal sign.
Bullish Morning Star Pattern


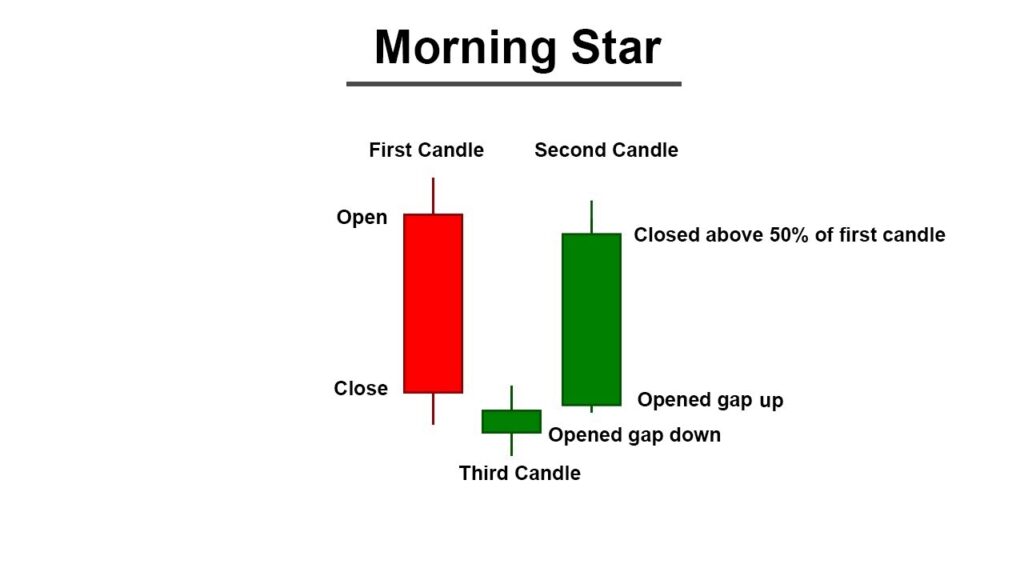
As like evening star candlesticks chart pattern , the morning star pattern is formed during the downtrend of the market and it signals probability of the trend reversal. Morning star is again a combination of 3 candles in which the first candle remains red the second / middle candle may be green or red but definitely closes below the previous days candle and also the next day’s candle and the next day’s candle color must be green.
Bearish harami


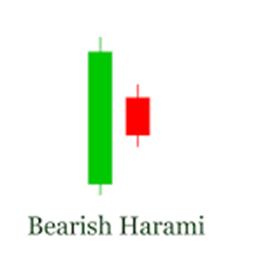
The name harami came from Japan and the meaning of harami in Japan is pregnant women as it takes a shape like pregnant women. The harami candlestick pattern is again a combination of 2 candles the first candle is big in size and green in colour and the second one is smaller in size and red in colour and remains at the middle to lower portion of the first candles body and is in bearish nature and signals probable trend reversal. In the upcoming blocks we will study these candlestick patterns in details with the live examples and how to trade these candlesticks patterns, when to trade these patterns etc.
BUllish Harami


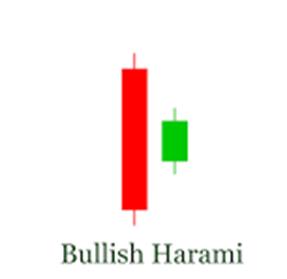
So as explained earlier for bearish engulfing the bullish engulfing is exact opposite, it is also a combination of two candle the first one became the red however the second one will became the green and the green candle is always in smaller size compare with the first candle and probably it is getting formed just middle or at the lower portion of the first candle and can be seen as above. As the name comes bullish this is a candlestick pattern which is bullish in nature and probability of trend reversal can be signaled from these type of candles.
Bearish Harami Cross


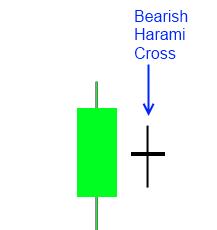
It is also a trend reversal candlesticks chart pattern and it is same like bearish harami and fuctions as like bearish harami however the second candle formed have no body or small bodle which is called as doji candle which is a indecision candle however if it is getting formed in combination then it is termed as bearish harami candlesticks chart pattern.
Bullish Harami Cross


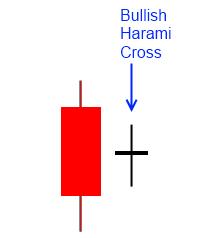
This is same like bullish harami candlesticks chart pattern and it is getting formed after a downtrend and signals the probable reversal of the trend with the doji candle formation after a red candle in a downtrend.
Bullish Rising Three


This is a combination of 5 candles which is getting formed in an uptrend and it signals bullish continuation of the trend and it is also called as a continuation chart pattern. The shape of the bullish three rising pattern can be seen from the above that is looks like capital letter “N” In an uptrend one big green candle formation followed by 3 red candle formation again one big green candle formation is seen in this patterns which takes out the fall of the previous 3 days and hence it is a strong trend continuation patterns which is getting formed in 5 candles combination in an uptrend.
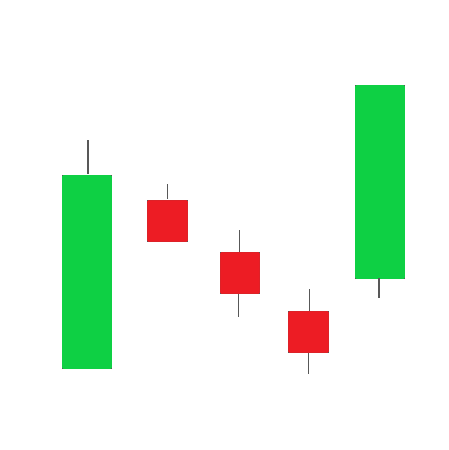
Bearish Falling Three


As like bullish rising three the bearish rising 3 is also getting formed in capital letter N shape in an down trend with the combination of 5 candles in which the first candle becomes red and bigger in size and next 3 candles are smaller in size in green in color afterwards 5th candle is again a red candle and takes out the 3 days rise is called bearish falling three which is a trend continuation pattern.
Beginner Traders Must Remember
You cannot learn the things in one day or after seeing one video and hence you are advised to study well and understand well and don’t trade blindly. We have covered the basics of candlesticks and the most important candlesticks chart patterns for beginner levels traders and going forward we will cover these patterns in details and how to trade these patterns and examples of each pattern and further more and more information and education on the stock market education, technical analysis, fundamental analysis, derivatives, how to maintain portfolio etc. we have also updated many contents in this series and you can go and check our blogs in education section.
Few important links and posted here below for your quick reference.
To support our mission in educating the retail traders and investors and if you don’t have demat account you can open Demat account through our below referral links or you can suggest your near and dear ones.
To Support us try to use below links to Open Demat Account for you/your near and dear ones
AngelOne () click on the link http://tinyurl.com/rtkkr6d
Alice Blue () click on the link http://app.aliceblueonline.com/OpenAccount.aspx?C=SSP158
Upstox () click on the link http://upstox.com/open-account/?f=E039
Zerodha (Rs.200/-) click on the link https://zerodha.com/open-account?c=ZMPAIP
5Paisa () click on the link https://www.5paisa.com/landing/partners-elite?rcode=NTIyMzQ5NTc