Education Topic (Technical Analysis) on RSI Divergence, Understanding the Power of RSI Divergence, Power Trading Using RSI Divergence, RSI Bullish & Bearish Divergence
Hello and Welcome Everyone, Today’s article is much practical and experience is shared in this article so kindly go through the same and leave your feedback. If you like the same may kindly share with your near and dear ones.


Relative Strength Index (RSI)
Relative Strength Index (RSI) is a very popular momentum indicator widely used by most of the technical analysts (traders) while taking the trading decisions. But the RSI indicator can also be useful for taking the investment decisions. RSI is plotted on the line chart and it oscillates between 0 to 100 and defines the oversold and overbought conditions. The RSI indicator was invented in 1978 by J. Welles Wilder.
Now traditionally RSI above 70 is termed as overbought condition & it signs that the security or stock or asset is overvalued and signaling the trend reversal but let me clear you that the RSI overbought does not mean that the stock will reverse from their, it may continue making higher highs and higher lows in overbought conditions. So yes RSI above 70 is to be used for taking the trade decisions based on the price action, shift in the price & momentum indicator in this case divergence which we will discuss as we proceeds. Like RSI above 70 is termed as overbought, RSI 30 & below is termed as oversold and it indicates that the stock or security or the assets can be brought in to so for taking the decision of trading or investing price action clubbed with RSI momentum indicator plays very important role.
We will not go deep in to the calculation part of RSI (Relative Strength Index), so while plotting RSI indicator on charts the default value of 14 period is to be kept & the powerful RSI Divergence Trading concept also we will use the same setting as default i.e. 14 period.
However for kind information of the viewers of this site the less the RSI period the faster it will give signals for buying and selling and as the period increases it will give the signals slowly.
Now coming back to our topic of Divergence – we will discuss with examples the bullish / positive divergence and the bearish / negative divergence
What is Divergence ?
Divergence means when the price of a stock or asset or security is moving in the opposite direction of the Technical indicator, i.e. oscillator is moving contrary to the price or the data and is known as Divergence.
Divergence on the charts warns you that the current price trend may be weakening, and in some cases may lead to the price changing direction i.e. trend reversal.
Bullish / Positive Divergence : –
In this case you will notice that the price is making lower lows and lower highs and RSI is also making the same as price but at some point of time the RSI action on the chart changes from making the lower lows to higher lows is called positive divergence.
Positive Divergence with the price confirmation gives us a very good opportunity to take a trade. So we will see some live examples of RSI bullish / positive divergence on the technical charts.

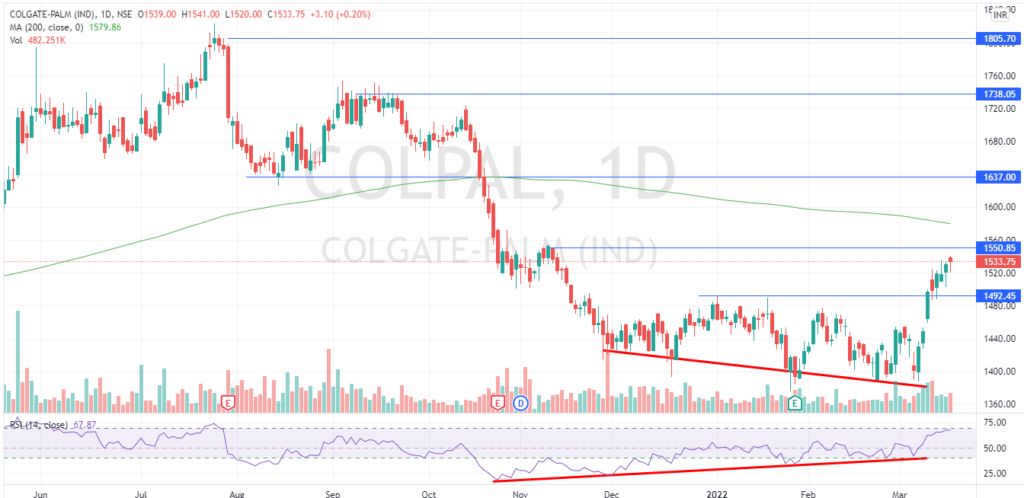
The above chart of Colpal (Colgate Palmolive) is live example of RSI bullish divergence on the chart and it has given a buy indication on the technical charts. Based on the positive RSI divergence the targets for Colpal are 1492 – 1550 – 1617 – 1738 & 1805. Wow what a nice to see the targets from the above charts, yes off course the RSI divergence is a powerful trading pattern and often gives such great targets if it goes in your favor but at times it fails. The success ratio of RSI Divergence comes in the range of 55 to 57 %. Let’s assume that the success rate of RSI divergence is 50 % still it will make you money if you are a disciplined trader / investor. Risk / Reward ratio always remains in favor while trading the RSI divergence and it improves if you follow the trailing SL (SL – Stop Loss).
So above Chart of Colpal will give you the direction of RSI power trading concepts, so keep following the same. I am updating few more charts on RSI positive divergence and then will update the charts on RSI negative divergence. For more clarity on the divergence I will also upload YouTube video at the end of this section.

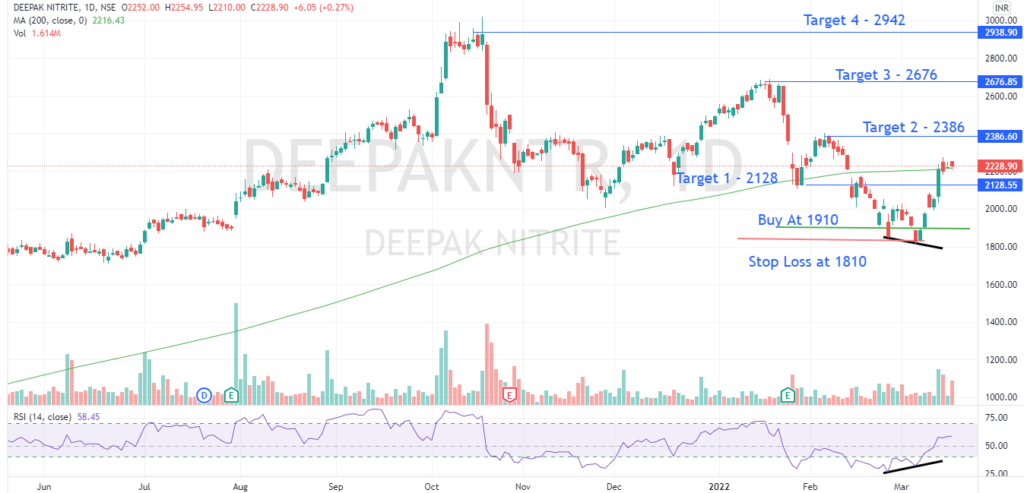
I hope by looking at the above charts now you are more excited that how this happens but yes it does happens at times it does fails. So I have placed one more chart for your monitoring and how it progresses. The risk reward is ultimate here. From 1910 to you have a chance of making 2942 wow that’s awesome and it may come true or it may reverse from any of the above levels so trailing sl will help for generating more and more profits.

Now we will see some examples of Bearish Divergence / Negative Divergence
Bearish / Negative Divergence : –
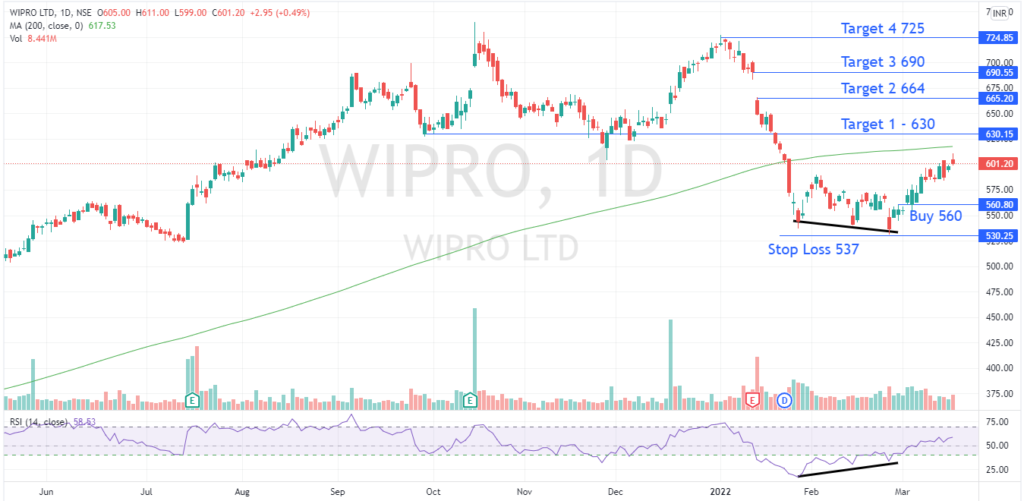
So we have seen couple of live examples of Bullish Divergence in the stocks like Colpal, Deepak Nitrate & Wipro etc. and now will see few examples of Bearish Divergence.
So bearish / negative divergence is exactly opposite to the bullish divergence and in the price is making the higher highs and higher lows and as like RSI is also making the same but at some point of time you will notice that the RSI indicator is making the lower highs opposite to the price action, which means there is a negative divergence wrt price movement and which is an indication of the trend reversal and for that you have to look for the price action to give the indication of reversal for making the short entry.
Now let me clear that by using the bullish divergence you can making trading as well as investment decisions however the negative divergence can be used for exiting the existing stocks for the case of investors. The short positions can only be made through future & options and hence the bullish divergence and bearish divergence have their own significance.


I hope the point is made clear to everyone, now we will see the live examples of bearish divergence

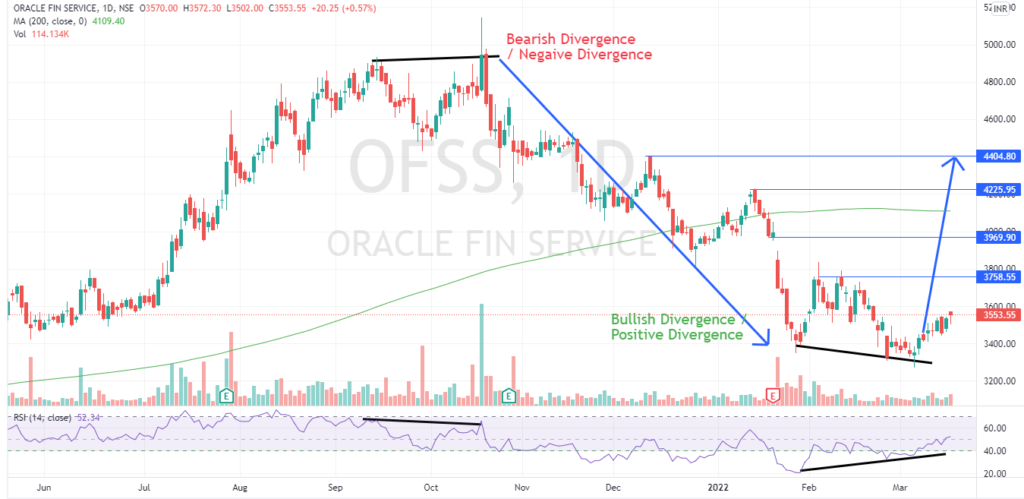
The above chart belongs to OFSS (Oracle Fin Services) and in this chart you are able to see the bearish divergence / negative divergence and after that the price fall seen from 5000 levels to 3200 levels so you can understand the power of RSI divergence and the potential of making money. Like wise now the live bullish divergence is also made on the same chart and which is having a high potential to go higher till towards 4400 levels.
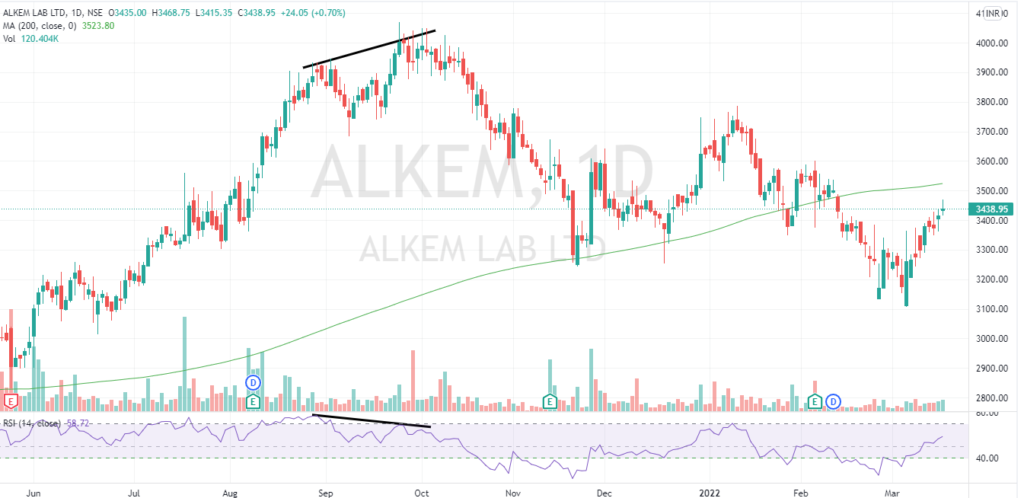
Again one more chart of Alkem Labs and see the power of divergence in the price action. The Alkem Labs have corrected from 4000 odd levels to 3100 levels.


By this time I hope you have understood the power of RSI divergence.

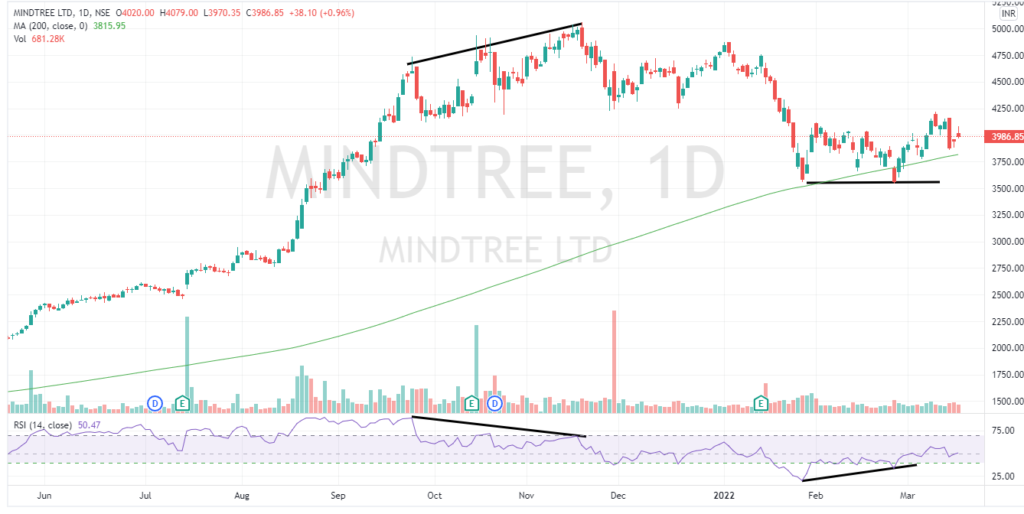
One more example of Positive Bullish divergence in making in Mintree and the Bearish Divergence in the same chart and bearish divergence chart target also acheived.

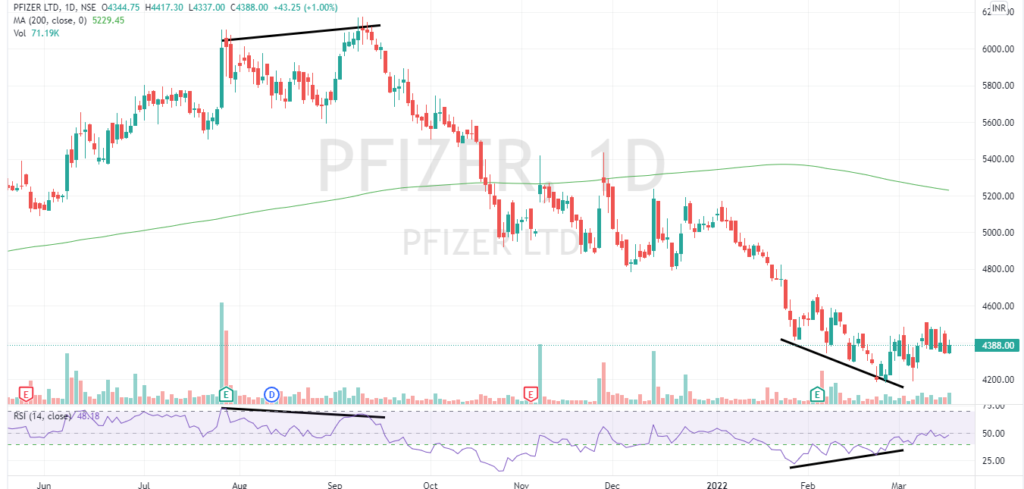
Pfizer another example of bearish and bullish divergence on the same chart.

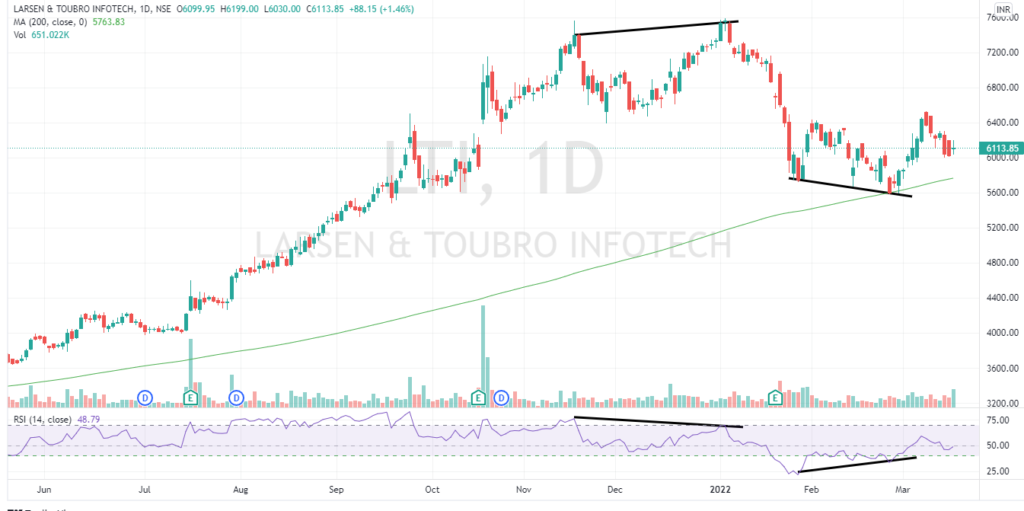
LIT Bearish and Bullish Divergence Examples


So will see one example of Divergence Failure

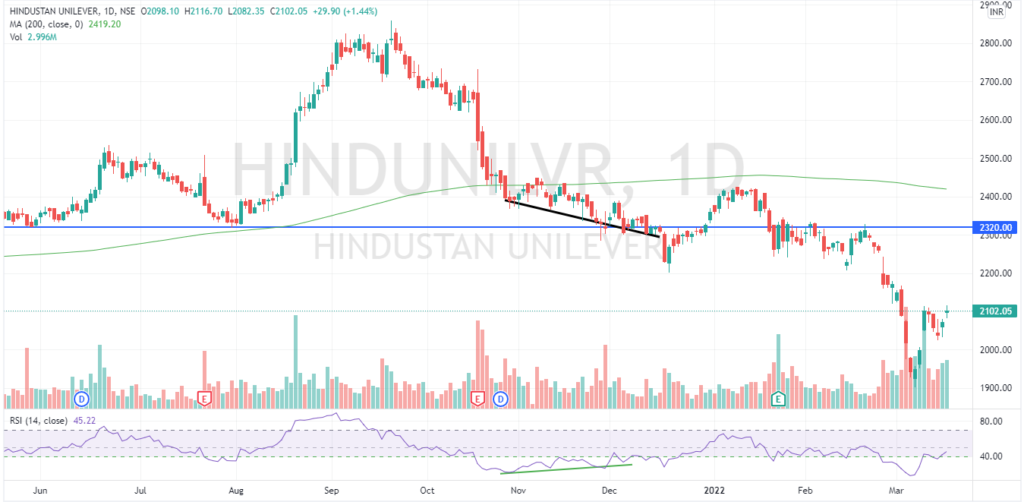
So the above chart of Hindustan Unilever shows the classic case of divergence failure.


In this article I have explained the concept of RSI divergence and the power of trading RSI divergence. In the upcoming articles I will update you further more articles for trading using RSI and the concept of RSI used for trading and investing.


Disclaimer :- The contents posted here are only for Educational purpose and not a recommendations to Buy or Sell any security, stocks or any asset. Do consult your financial advisor before taking any trade decisions.