
Stock Market Outlook – Stock Market Analysis and Prediction for Upcoming Week Starting w.e.f 7th June 2021
In this section we will discuss about the stock market movement and based on the technical charts and options data we will try to predict the stock market direction / range for next week / upcoming week. Basically we will study the nifty and bank nifty charts in this section and after analysis we will be able to conclude the market direction, important support and resistance levels which can ultimately help in traders and investors for getting the picture on the market and help them taking in a trading and investment decisions.


Nifty Prediction for Next Week, Nifty Overview, Nifty Options Chain Analysis (7th June 2021 to 11th June 2021)
Last week Nifty hits fresh all time high and making fresh highs of 15733 and nifty closed at 15670 with small correction at the end of week.
https://in.tradingview.com/chart/tWswsFjd/?offer_id=10&aff_id=26808

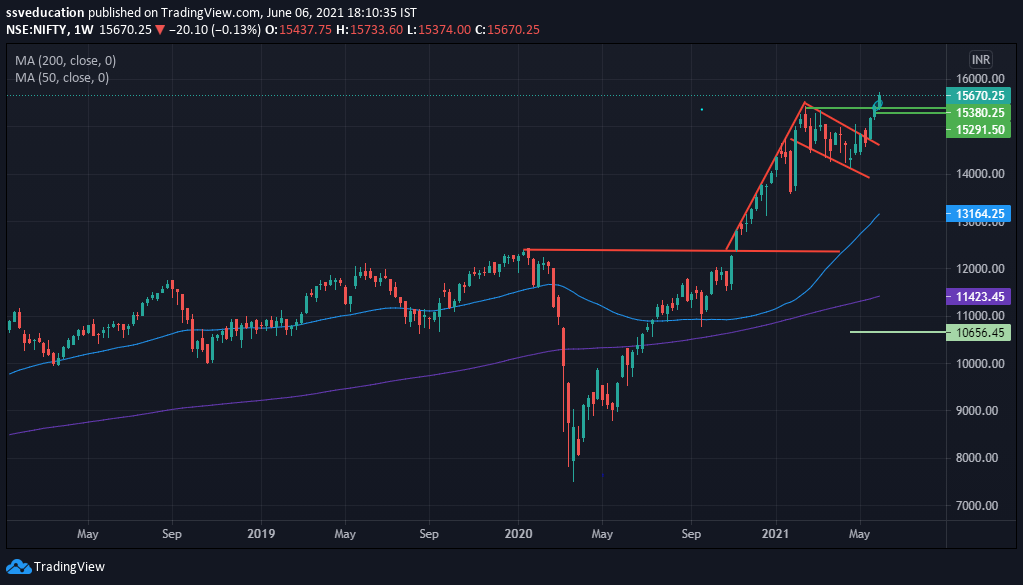
Above weekly charts of the Nifty giving you the longer terms picture and you can see the flag and pole breakout in nifty weekly charts and from the weekly charts we can draw the longer term targets for Nifty which comes arroung 16750 to 17000.
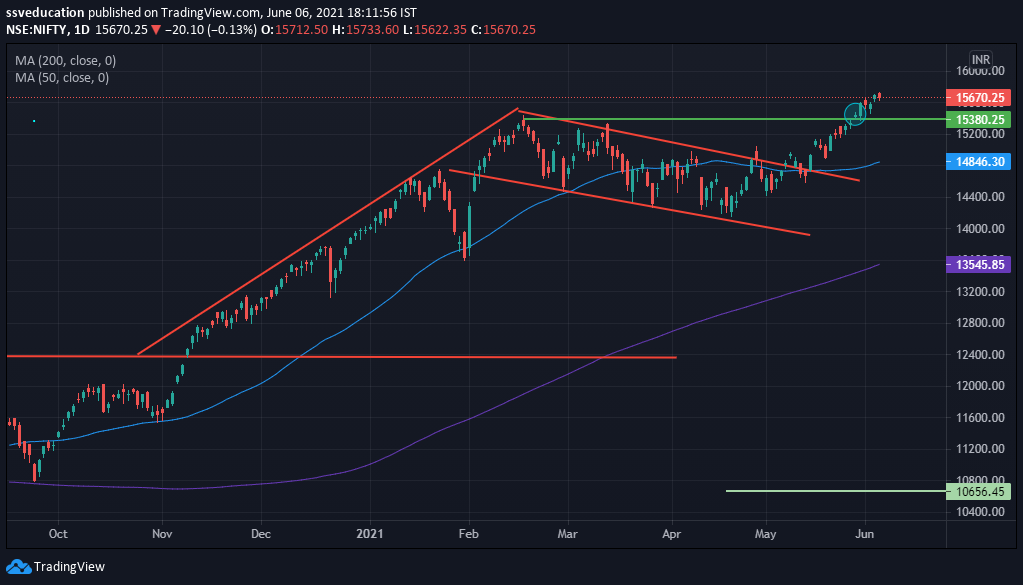
Now let us have a look at Nifty Daily charts which clearly broke out of the previous all time high range and closed week at almost highest level of 15670 after hitting 15733 levels. Now the previous all time high i.e. 15431 will became the support for nifty and the investors and traders should apply buy on dips strategy for next week so that new highs can be captured. You can also refer the nifty video for more understanding.


Nifty Options Chain Analysis
From the Options Chain Data refer the options chain below in the table it looks like 15600 & 15500 are the key support areas, going forward we may not see the nifty below 15500 in next week.
Key Support – 15500

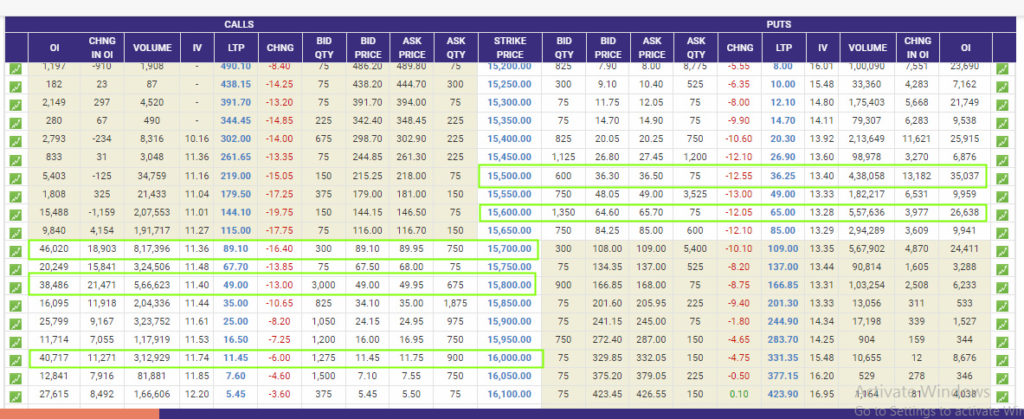
However on the resistance we can see the resistance at 15700 & 16000 levels. Break above one level we can expect the next levels.
Key Resistance – 15700


Bank Nifty Analysis , Banknifty Prediction for Next Week (7th June 2021 to 11th June 2021).
Last week Banknifty traded in a tight ranged and moved from 35810 (High) to 34930 (Low), Nifty closed at 35291 levels. Lets have a look at Bank Nifty Charts as below
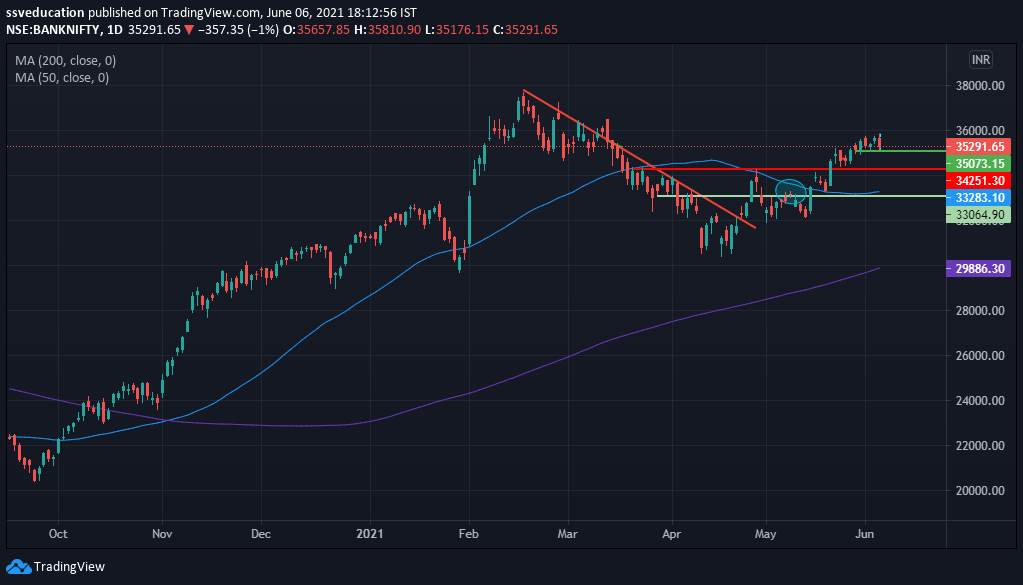
Banknifty present close is at 35291 previous week close at 35141 and 35100 is the key support area you can see from the charts as above. Now for next week we can expect some bounce back in banknifty and if sustain above 35500 we may see 36000 and 36500 kind of levels in next week so watch out for these levels. Also Have a look at Options Chain and Bank Nifty Video for more understanding
Click Here To Open Trading and Demat Account with Upstox Best Offer for You
Bank Nifty Option Chain Analysis

Key Support – 35000 (We might not see 35000 below in next week levels) so 35000 is the key point as per options chain. Slide Below 35000 next support comes at 34500 is also the key area.
Key Resistance at – 35500 (Immediate resistance) , 36000 and 36500 we can expect bank nifty to move towards higher levels.
So from the Option Chain Analysis we have to keep in mind the levels as derived from the derivative data.

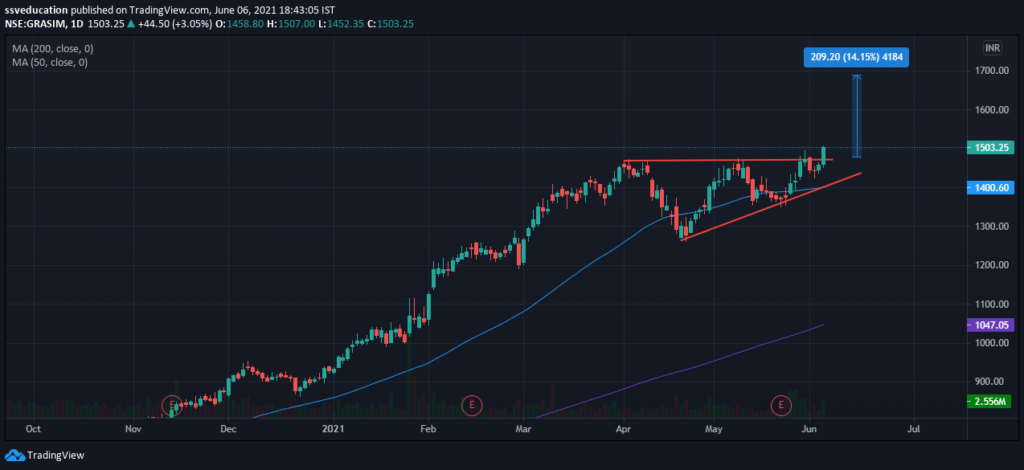
F&O Trade Set Up – Grasim Industries Ltd, the trade set up is for Futures and Options traders off course cash traders also can take the positions and the levels are updated below at cash levels. This trade set up offers good favorable trade set up with a Risk – Rewards of 1:3 Buy at CMP 1503 with SL at 1432 Target at 1713 (70 SL & 210 Points Target) Last week also we have updated Grasim with 1:4 risk reward)
Options Trades can think of Buying 1500 call option at 52 with stop loss at 26 Or if want to take little risk can buy 1600 Call Options which is trading around 17.70.

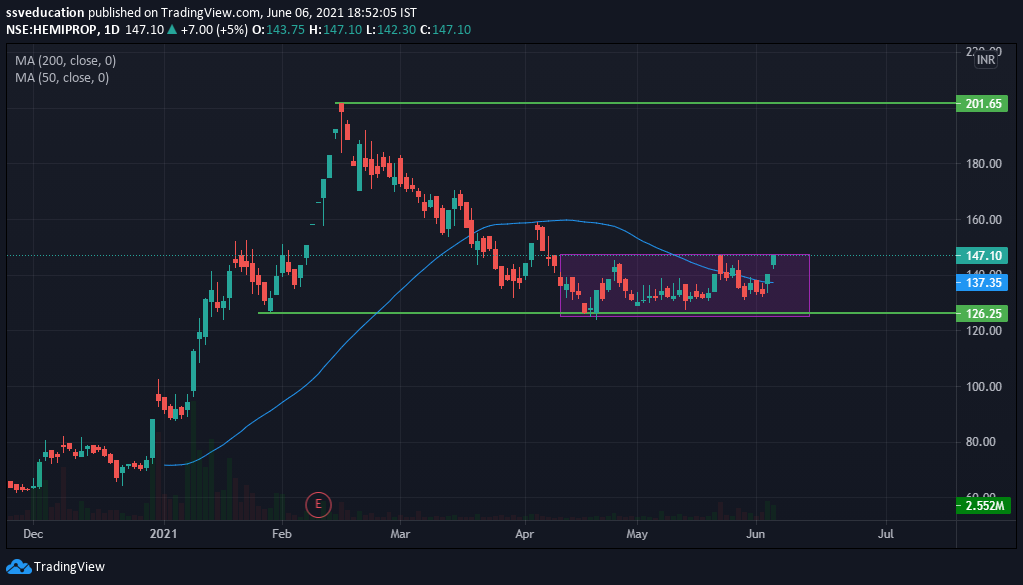
Hemisphere Properties
Let us have a look at below chart of Hemisphere Properties the stock is expected to come out of the trading range marked on charts i.e. 126-148 and now once cross above 148 we can see the levels of 201 and higher . Stop Loss for this trade can be placed below 126.

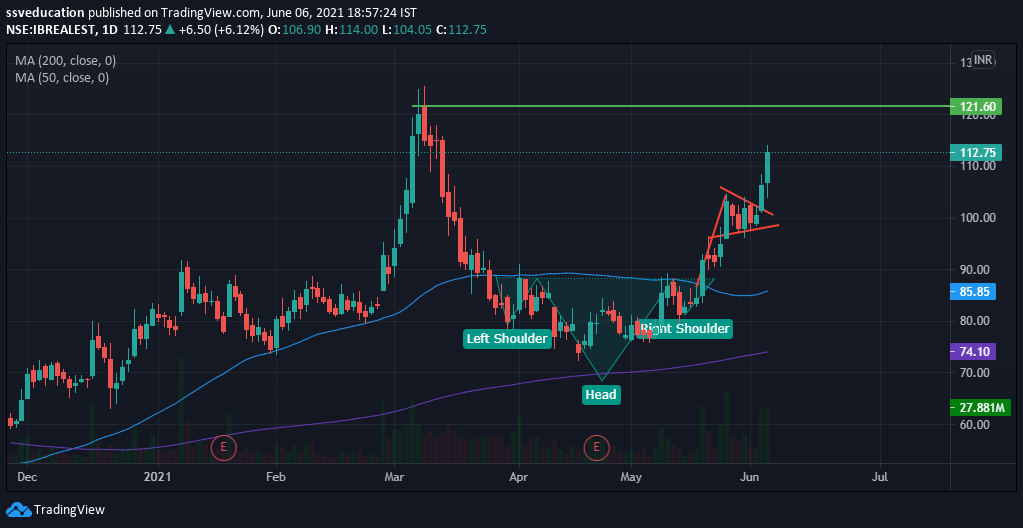
India Bulls Real Estate
Let us have a look at the below Daily chart of India Bulls Real Estate Company after Inverse Head and Shoulder breakout the target achieved and the second stage flag formation target comes at 121. 121 is the crucial level for India Bulls Real Estate Stock so once break above 121 levels we can see 140 + Levels.


Disclaimer : – The contents posted here are only for Educational purpose and not a buying or selling recommendations, do consult your financial advisor before taking any decision.