
Stock Market Outlook – Stock Market Analysis and Prediction for Next Week
In this section we will discuss about the stock market movement and based on the technical charts and options data we will try to predict the stock market direction / range for next week / upcoming week. Basically we will study the nifty and bank nifty charts in this section and after analysis we will be able to conclude the market direction, important support and resistance levels which can ultimately help in traders and investors for getting the picture on the market and help them taking in a trading and investment decisions.


Nifty Prediction for Next Week, Nifty Overview, Nifty Options Chain Analysis (17th to 21st May 2021)
Last week we have seen Nifty after touching the upper line of the channel at 14966 corrected and made a low of 14591 and nifty is still consolidating in a downward trending channel, however if you look at the weekly charts you can notice a kind of flag formation of nifty. So its wait and watch situation for next week also updated below chart and analysis for upcoming week.

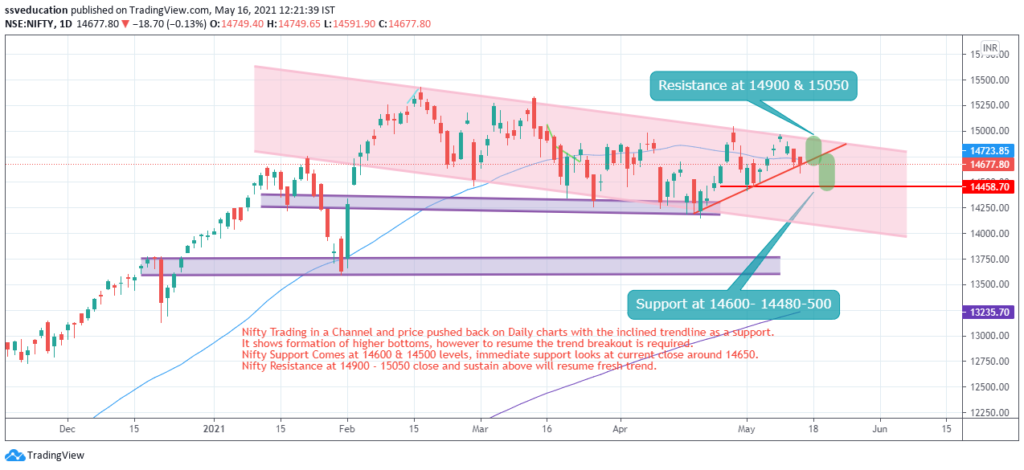
Let’s have a look at above Technical Charts of Nifty, Form the charts, we can analyze that Nifty is consolidating in the pink color channel and the resistance zone is upper end of the channel that is arround 14900 levels and support is coming towards 14650, 14500 -14480 kind of zone. The present move and pattern on the technical chart is indicating the Nifty biased in positive direction and for breakout needs to close above 15050 levels. Fresh trend will resume once nifty break and sustain above 15050 mark whereas break below 14480-14500 zone we can see the downward move toward 14150-140000 levels. .


Nifty Options Chain Analysis
From the Options Chain Data refer the options chain below in the table it looks like 14600 & 14500 are the key support areas, going forward we may not see the nifty below 14500 in next week.
Key Support – 14600 & 14500


However on the resistance we can see the resistance at 14800 – 14900 & 15000 levels. Break above one level we can expect the next levels.
Key Resistance – 14800-14900


Bank Nifty Analysis , Banknifty Prediction for Next Week (17th to 21st May 2021).
As explained during the last week market outlook banknifty formed double bottom and bank nifty holding above 32000 levels and so last week banknifty corrected 33297 levels and traded in 1100 points range in a week.
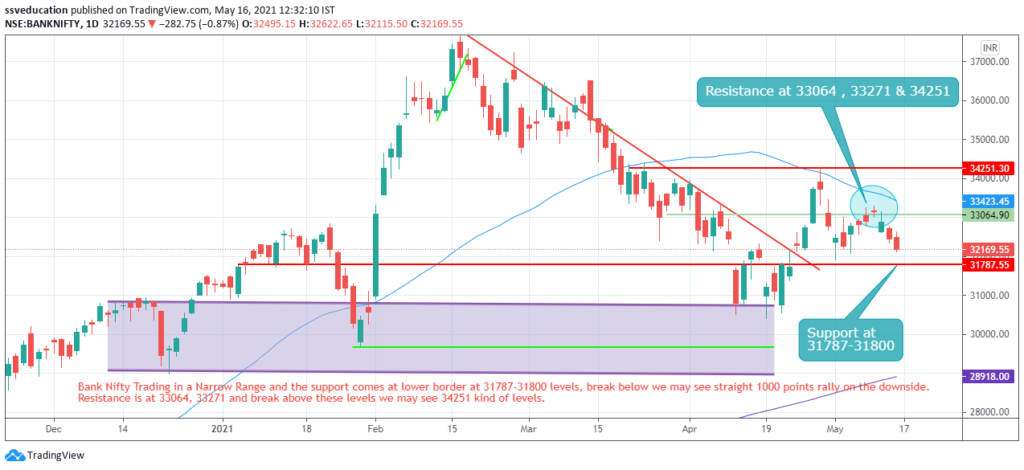
Banknifty present close is at 32169 and now the key area of support is 31787-31800 and if it violates the same then we can see further downside towards 30700 however resistance comes at 33064 and once crossed 33271 we might face resistance at 34250 levels.
Click Here To Open Trading and Demat Account with Upstox Best Offer for You
Bank Nifty Option Chain Analysis

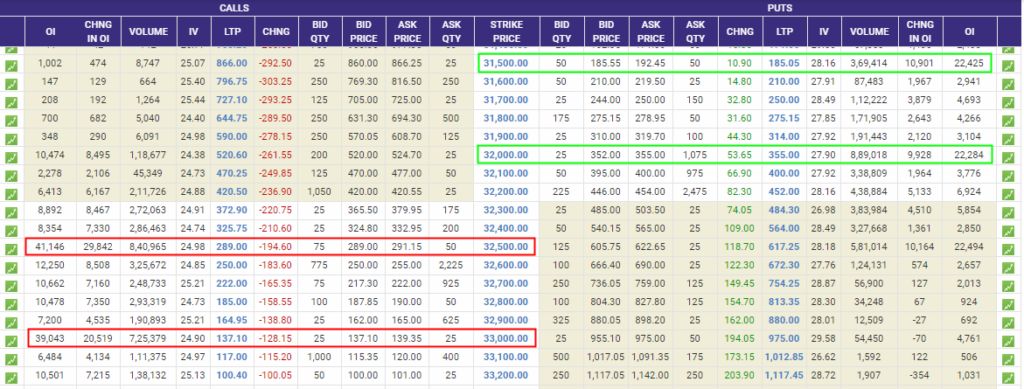
Key Support – 32000 & 31500
Key Resistance at – 32500 , 33000
So from the Option Chain Analysis we have to keep in mind the levels as derived from the derivative data.
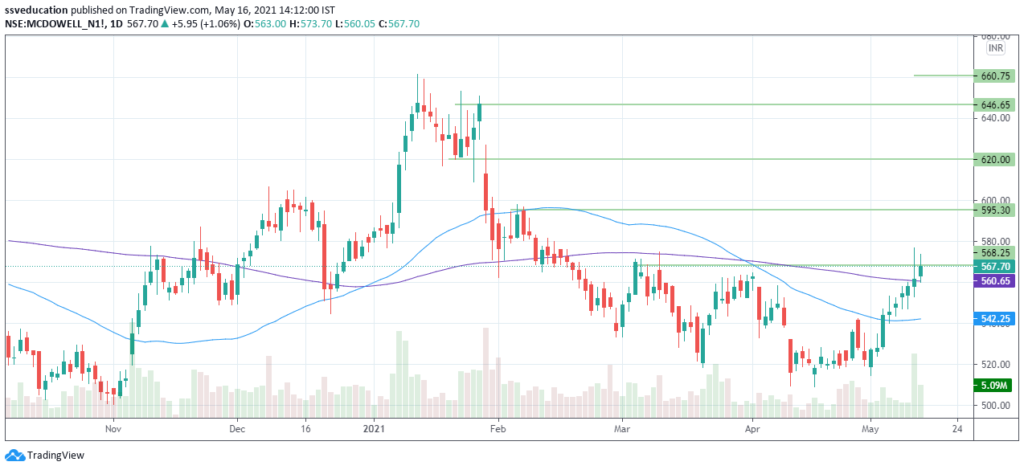
F&O Trade Set Up – United Sprits Ltd Future can have a good favorable trade set up with a Risk – Rewards of 1:4 Buying Zone Near CMP – @ 565 and SL at 551 Target at 620/640 (14 SL & 56 -76 Points Target)
Options Trades can think of Buying 580 Call Options between 9-10 with SL of 5 current month expiry and keep trailing and if some one want to play secured can short 600 Call Option so that the net premium can be collected. Even 600 CE is trading around 6 so net premium will come only 4.
Stocks to keep on Radar (Stocks can have potential to became multibagger form current levels)
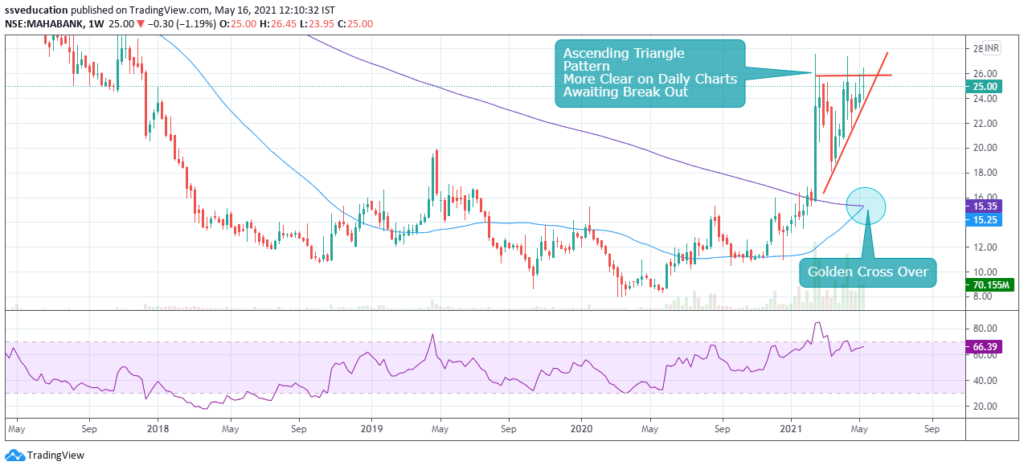
Bank Of Maharashtra
Have a look at below chart of Bank of Maharashtra showing strength on weekly charts and you can see the formation of ascending triangle awaiting for breakout. The ascending triangle is marked on weekly charts it is more clear on daily charts. Bank of Maharashtra weekly chart you can also see the Golden Cross Over of 50 period moving average crossing the 200 period moving average from the downside which is a clear indication that the stock is getting ready to fly. Once the stock break above 26-27 and sustain above 28 we can see the stock to get double in coming months. Great potential for short to medium terms investment.

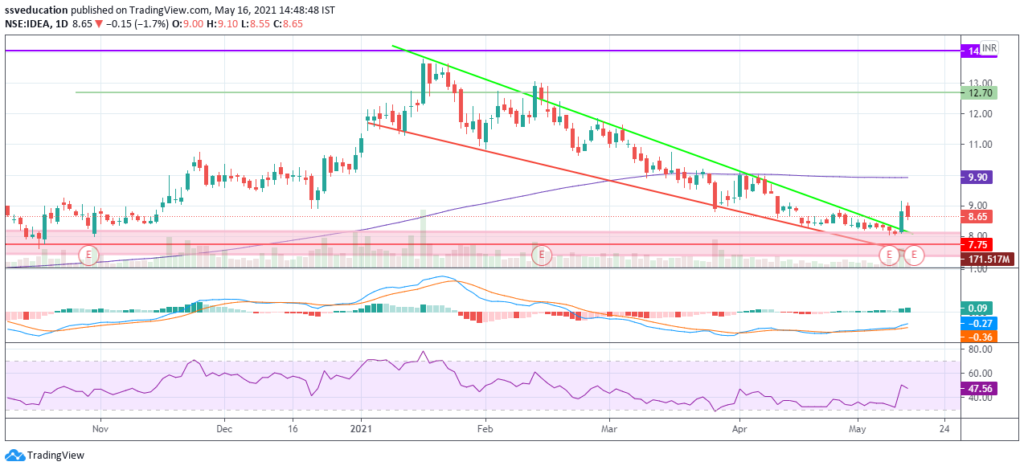
Vodafone Idea : A High Risk Trade Set Up
Vodafone Idea has fallen sharply after making a high of 13.80 in the month of January 21 and since then the correction is going on in Vodafone Idea. Vodafone Idea is trending downwards in a falling wedge pattern and on 12th May trading session the breakout was seen in Vodafone Idea stock and probably it is likely that we can see the higher levels in the days to come. The levels expected are around 12.70 levels initially and later the review will be done once these levels are achieved and as discussed the stock is in high risk category so stop loss for this trade is must and the stop loss can be placed at 7.75 levels.
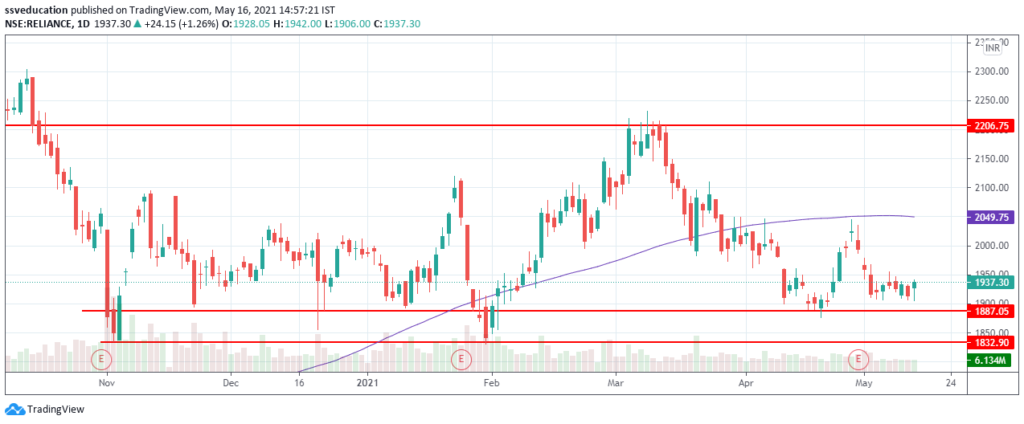
Reliance Industries
Reliance is trading in a narrow range and underperforming the market for quite some time however it is likely that Reliance is probably getting ready for bigger movement and the based formation is done in Reliance stock. Reliance stock can be accumulated in the range of 1900-1950 with a stop loss at 1878. Reliance is having a great potential to give higher returns in the upcoming weeks ahead.


Disclaimer : – The contents posted here are only for Educational purpose and not a buying or selling recommendations, do consult your financial advisor before taking any decision.