
Understanding Ascending Chart Pattern in Technical Analysis and Emerging Trade Set Up in Cipla for traders and short to medium term investors for 12-15% returns


This Trade Set Up is based on Technical Charts and the chart is also Updated below for your kind reference. The trade set up is for short to medium term. The trade Set Up are selected based on high probabilities however money management is to be ensured.


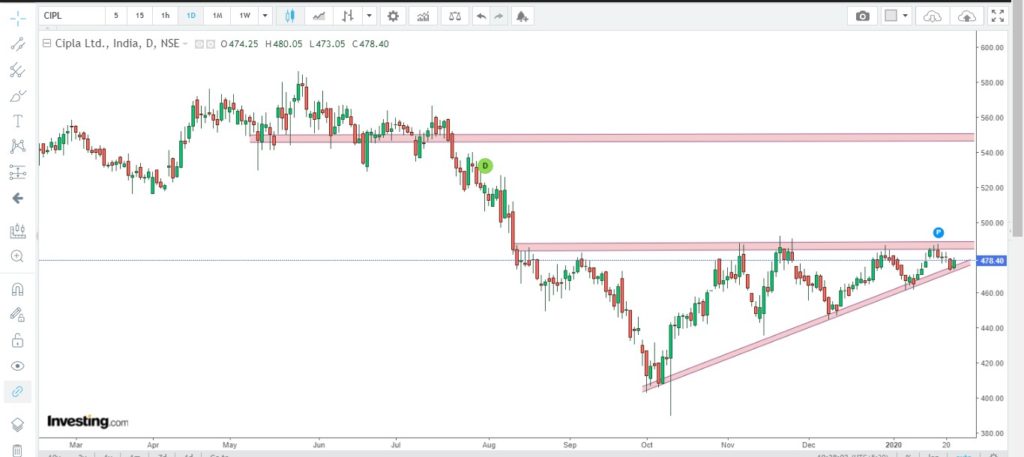


Cipla Ltd is a fundamentally strong company and consistent performer. Technically it was in a downtrend after a down trend it is forming a ascending triangle refer the chart and for understanding ascending triangle pattern refer the video. Ascending triangle is a continuation chart pattern in technical analysis but at times it also act as a reversal pattern. If you have a look at Cipla Daily chart it is forming a ascending triangle chart pattern and is likely to act as a trend reversal pattern in this case. Cipla on chart forming the higher lows and highs are almost flat which is a bullish sign. Hence in Cipla I am expecting a breakout which will eventually give the targets towards 545 to 560 levels. That comes to 12-15%.


Important disclaimer
Please make a note that nifty and banknifty index futures weekly trend analysis / levels posted here is based on our studies and the knowledge we have on the markets. All the contents posted here are for educational purpose only and it is not a buy or sell recommendations.


To join our telegram channel follow below link
https://t.me/onlycrudeblaster https://t.me/joinchat/AAAAAEO7D0uuz3Evm7oD-Q
or simply type t.me/ssveducation on telegramm to join to our channel


If you like the post don’t forget to share. Any suggestion please update in the comment section.
To join the telegram channel ping on the numbers 9406056301
For queries you can email us on info@ssveducation.com