
Understanding Double Bottom Pattern – How to Trade Double Bottom Pattern, Live Examples of Double Bottom Pattern – Nifty and Tata Consumer Products


Introduction
Double Bottom formation is a very popular chart pattern, which is pretty easy to recognize on the price charts. Double Bottom Pattern is called as a reversal pattern and formation of Double Bottom pattern on charts is an indication of trend reversal. Double Bottoms are always getting formed on charts after major or minor down trend in a particular security / stock / index and gives signal of reversal and potential trend reversal.
The Double Bottom Pattern looks like letter “W” & the twice touched lows are the support levels. Duration of Double Bottom Formations also matters; longer duration in formation of double bottom gives high probability of success.
Double Bottom looks like

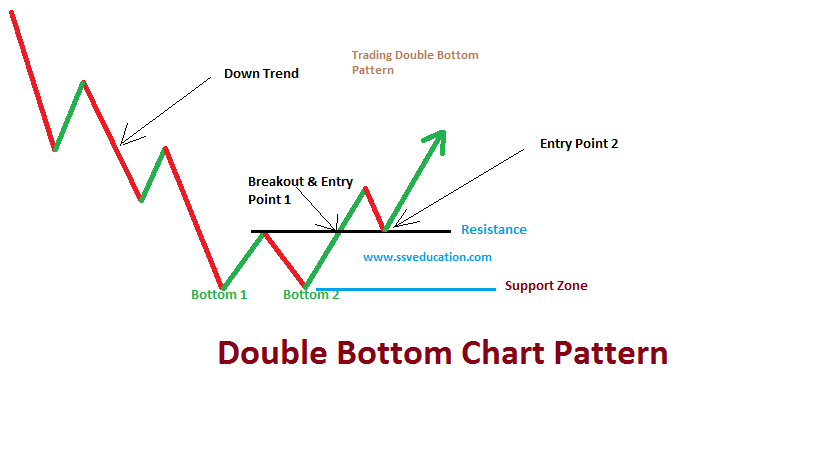
Now from the appearance of double bottom chart pattern (refer image above) on the price chart indicates that the momentum is transferring from the sellers to buyers. It is very clear that go long when the price goes above the neckline while trading the double bottom chart pattern. In some instances you can get the second entry point on retest & the patterns are highly reliable.
How To Trade The Double Bottom Charts Pattern?
Double bottom patterns are highly reliable patterns for trading if identified correctly. The lows of both the bottoms should be equal or the difference in both lows shall be within 3 to 4 %. In this chart pattern the lows are the support levels where stop loss can be placed and the entry point is breakout above previous high which gives W shape on charts & the trade can be executed for 1:2 to 1:3 risk rewards & can be trailed for higher targets.
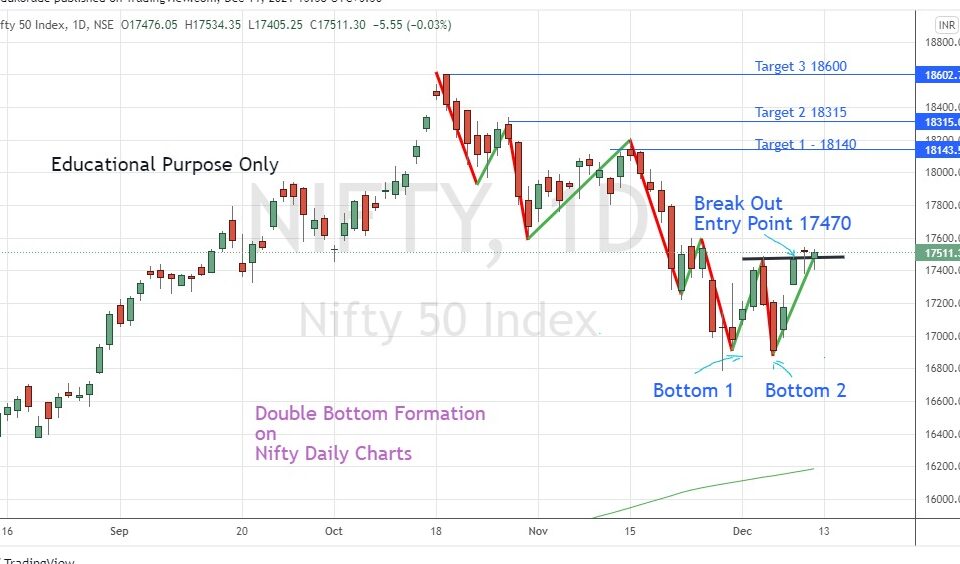
Nifty Daily Chart – Formation of Double Bottom noticed on Nifty Daily Charts
Let’s have a look at the nifty technical charts showing the formation of double bottom charts pattern & you can take a decision whether this Nifty Technical Chart is tradable or not. Also share your views about the updated information

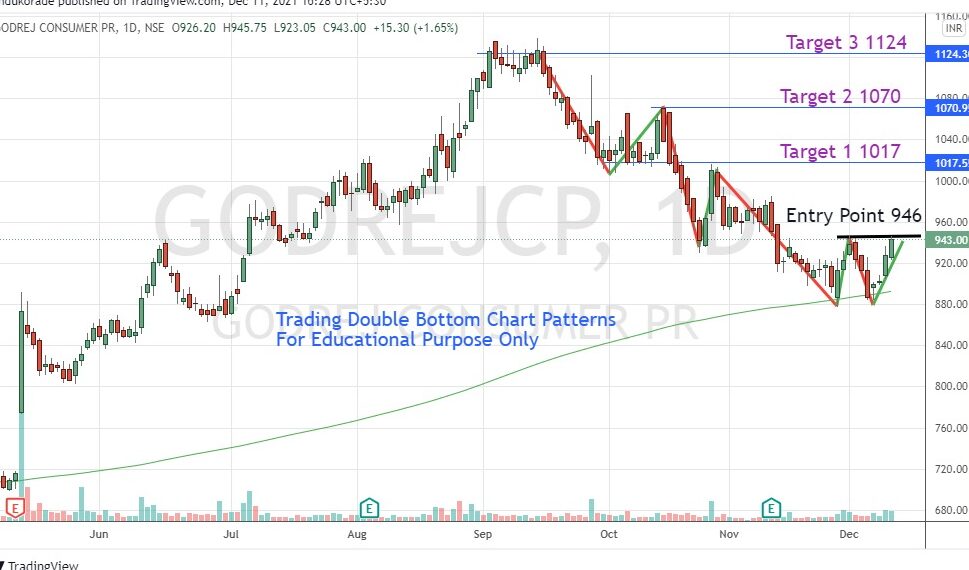
Double Bottom Formation on Godrej Consumer Products
Double Bottom Formation seen on the below chart of Godrej Consumer Products & it is in the verge of break out which can be a good trade set up for traders as well as good short to medium term investment idea.

So today we have covered a most reliable technical chart pattern and the risk reward and success ratio is awesome in this technical chart pattern. The viewer can use the above information for study and can identify similar chart patterns in their studies.
Also request you to kindly share these post to your near and dear ones so that they can also benefit from the same. Your feedback on our contents will be highly appreciable and also you can share the patterns identified by you in the below area provided for users massage section.

Standard Disclaimer : – All the contents posted are for Educational Purpose Only.
Notice: JavaScript is required for this content.