
Understanding Head & Shoulders Pattern – How to Trade Head & Shoulders Pattern

Introduction
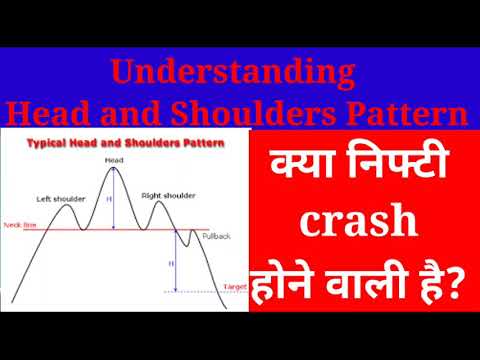
Head and Shoulders formation is a very popular chart pattern, which is pretty easy to recognize on the price charts. Head & Shoulders Pattern is called as a reversal pattern and formation of head and shoulders pattern on charts is an indication of trend reversal. Head and Shoulders are formed on charts & gives both bullish and bearish Head and Shoulders patterns, and both indicate potential market reversals.


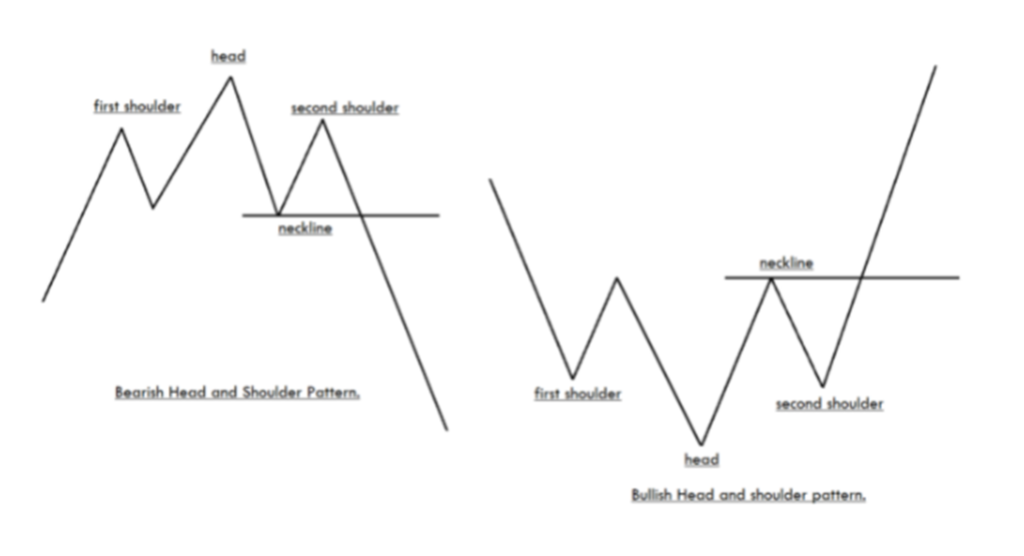
This pattern consists of three peaks, which is developed after a strong bullish trend. The first and third peaks are of the same height, and they are classified as shoulders. The second peak of the pattern is the highest and hence classified as the head.


There are both bullish and bearish Head and Shoulder patterns. The appearance of bullish Head and Shoulder pattern on the price chart indicates that the momentum is transferring from the sellers to buyers. Likewise, the appearance of the Bearish Head and Shoulder pattern indicates the momentum is transferring from the buyers to sellers. While trading the Bearish Head and Shoulders pattern, it is advisable to go short when the price breaks below the neckline. Contrarily, go long when the price goes above the neckline while trading the Bullish pattern.

How To Trade The Head And Shoulders Pattern?
It is suggested that not to wait for the perfect pattern (bookish pattern) instead look for the good entry/exits when you spot the pattern on charts. Sometimes you can notice that the left shoulder will be bigger than the right shoulder and vice-versa. Please do not focus on minute details as practically pattern on book and on charts always defer, so better to spot the patterns and trade what you see. So once again I would like to mention that your focus must be on deciding factor is the pattern looks reliable enough to trade or not ?. If your answer is yes, then only take entries.
Bearish Head And Shoulders Pattern
The below chart represents the formation of the Head and Shoulder pattern on the City Union Bank.

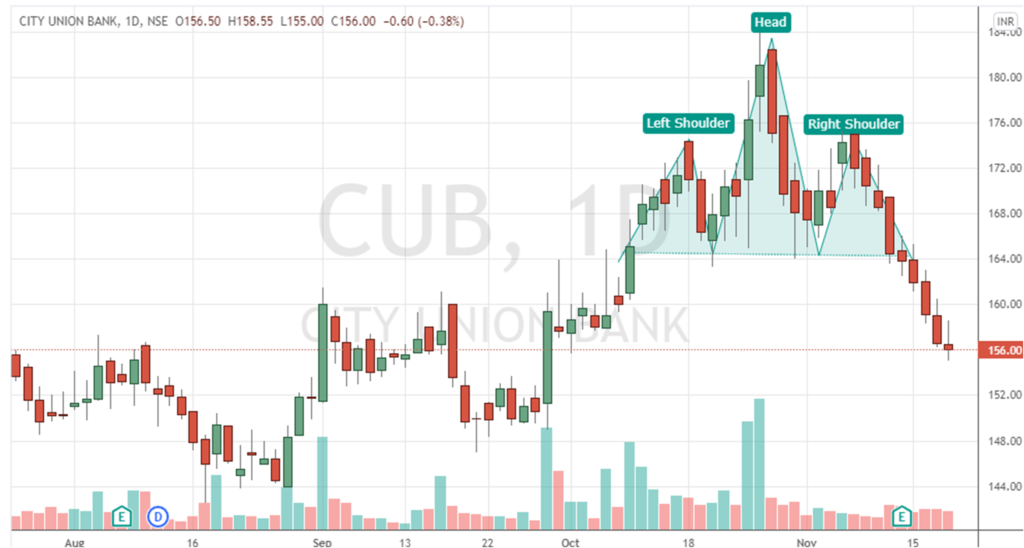
Let us have a look at the above chart of City Union Bank where you can see the formation of Head and shoulders pattern and the pattern break the neck line at 164. This is the live example of Head and Shoulders Pattern and the target as per the pattern is still on which is expected to be 148 so keep a watch on it.
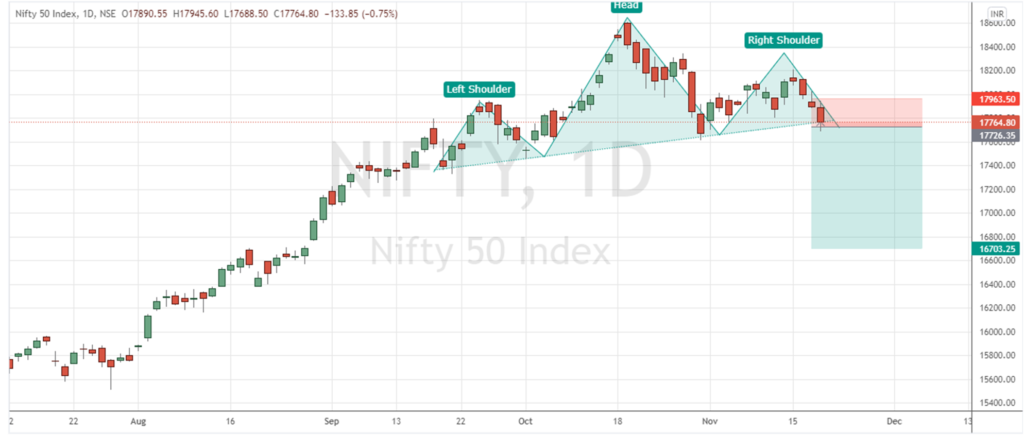
Now a hot chart which is to be observed for break down and the chart is for Nifty
Nifty Technical Chart – Current Head and Shoulders Pattern Formation on Technical Chart, Can Nifty Break the Neckline? Can Nifty Going for Crash?


More charts coming on the way to understand the pattern and how it performs?
Disclaimer : – All contents updated here are for Educational Purpose Only.