


Hello Everyone,
In this article we are going to discuss the most powerful & reliable technical chart patterns and we will also update you how these chart patterns are traded to make money. Trading in technical chart patterns with discipline, proper money management is the secrete of making money in the stock markets. Our efforts are to educate the peoples on the stock market so that when they enter into market with proper knowledge they will stand in the market and will start making money.
To get more and more educational topics on stock markets please help us in growing towards our vision and be a part of it, share the topics to your near and dear ones and also those who are interested in demat account opening –open demat account through our referral links of Zerodha, AngleOne, Upstox & 5Paisa.
- Link for AngelOne http://tinyurl.com/rtkkr6d
- Link for Upstox http://upstox.com/open-account/?f=E039
- Link for Zerodha https://zerodha.com/open-account?c=ZM…
- Link for 5Paisa https://www.5paisa.com/landing/partne…
The links are shared below and also you can click on the broker name above you will be redirected to the account opening links.
Chart Patterns are basically getting formed on the price charts in the form of certain shapes and can be easily identified. Chart Patterns gave us the idea on the movement of stock price based on the past historical data and they are repeating on different time frames.
In technical analysis understanding chart patterns play very important and vital role in the life of a trader or investors. Believe me if you only follow the below explained technical chart patterns you need not require to study any other things.
So understanding the chart patterns in depth and in simple form will be guiding star for all of them who follow it correctly. So the secrete here is which pattern is tradable and when to trade them I will explain the same here for betterment of followers of our site.
The Chart Patterns are of two types
- Continuation Chart Patterns – In this type of patterns the price resumes the prior trends which persists on the price charts and continue to move in the same direction.
- Reversal Chart Patterns – In this type of patterns the price reverses the prior trends which persists on the price charts and continue the in the opposite direction of the earlier stock price move.
So going forward we will discuss here the most powerful price chart patterns having good success ratios over 60% after formation of the pattern.
Trend Reversal Chart Patterns
- Head and Shoulders: –
As explained earlier Head and shoulders is a reversal chart pattern in which at the center of it you will find a large peak and has a slightly smaller peak on both side of it. Traders look at head and shoulders patterns to predict a bullish-to-bearish reversal. i.e. After formation of this head and shoulders pattern one can expect the price has reached it’s peak and is ready for reversal.
Typically, the first and third peak will be smaller than the second refer the below chart to understand the structure of the head and shoulders technical price pattern.
In this pattern price move up and then will all fall back to the same level which is called support or otherwise known as the ‘neckline’. Once the third peak has fallen back to the level of support, it is likely that it will breakout into a bearish downtrend.

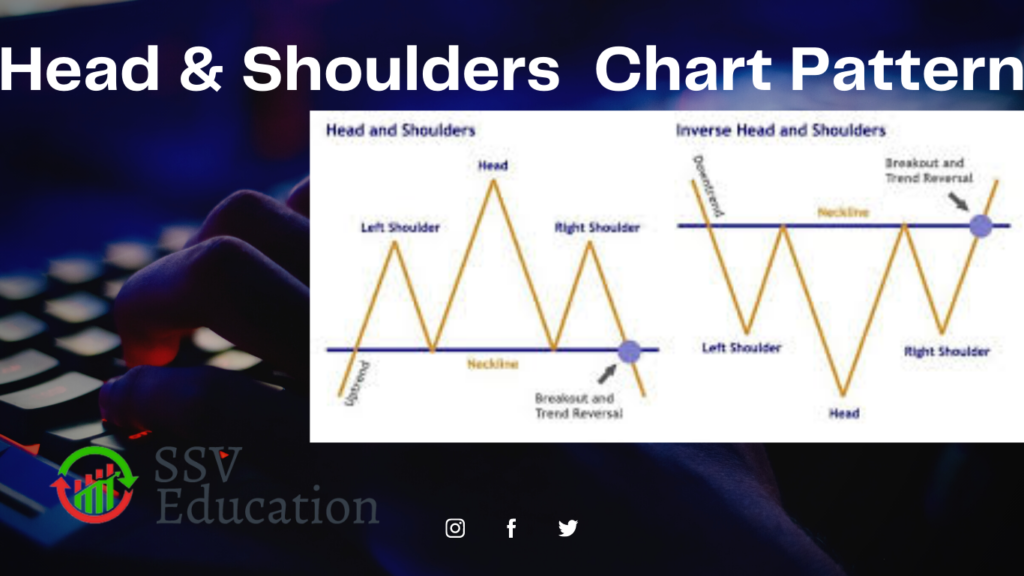
- Inverse Head and Shoulders: –
Head and Shoulders Pattern are formed in bull markets i.e. up trending market and also in the bear markets i.e. down trending markets and they are termed as head and shoulders & inverse head and shoulder respectively. Inverse head and shoulder pattern is exact duplicate copy of head and shoulders and it’s getting formed after making a series of lower low and lower highs. i.e. server down trend.
For more details with live examples please have a look on the exclusive post on the head and shoulders price patterns.
- Double Bottom Chart Pattern: –
Double Bottoms are again a trend reversal chart patterns and are getting formed in the bear markets when the prices are continue to fall making the lower lows and lower highs and at one point of time you will see that the price has made equal lows instead of making lower lows and in such cases you can say that the double bottom is getting formed on the technical price chart pattern however the confirmation will come once the price make a move above previous high and at that point a trader makes entry expecting the same level of targets, however once the double bottom is formed on charts and given a clear breakout one can expect that the trend has definite reversal and can keep following the trend unless any price reversal comes with following a trailing stop loss.
The point of getting equal low formation has become a support for the stock and one can place initial stop loss below the low of the support line and keep on trailing as the stock moves up. The point where price breaks out the previous high with formation of “W” shape is called Neckline in this case.
Double Bottom Looks like below
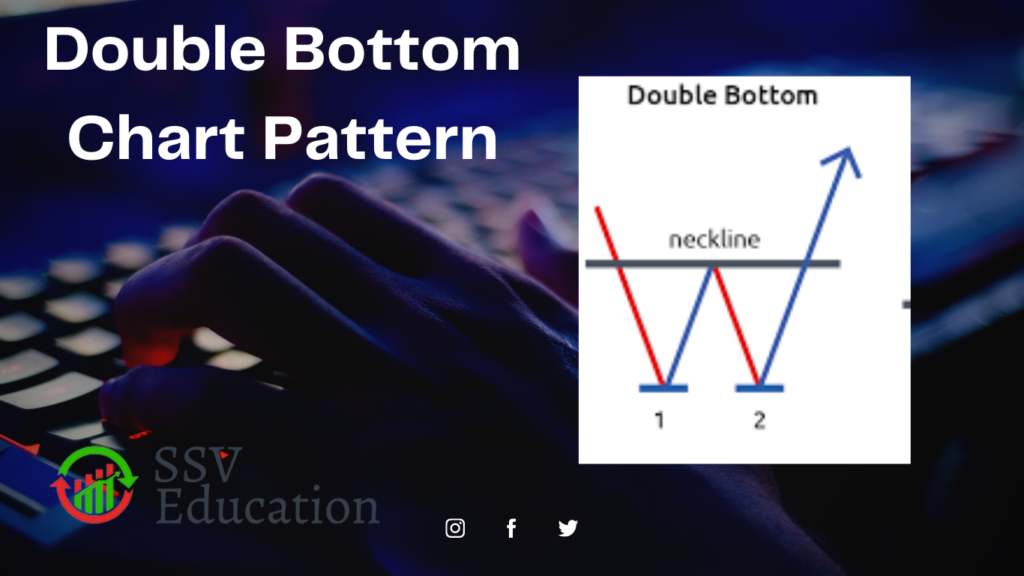
One can also trade this chart pattern immediately after formation of equal low in the down trend with the positive candle signal with the stop below the support line, however the chances of getting success is lesser in such cases but the risk to reward remains highly favorable in this case.
For more details with live examples please have a look on the exclusive post on the double bottoms price patterns.
- Double Top Chart Pattern: –
Double top pattern is also a reversal price chart pattern in which the stock is in a continuous up trend and keeps on making higher lows and higher highs on the price chart and at some point of time you will notice that the price coming to a certain level where equal highs are getting formed on the price chart pattern and one can make it clear that the price is likely to form a double top on the price chart. One the previous low is broken on the price chart one can say that the double top formation is completed on the price chart and the trend reversal is likely form the point of breaking the neckline called support and trade can be initiated with the target of the height of the pattern, however the price can fall further as the double top is a definite price reversal chart pattern.
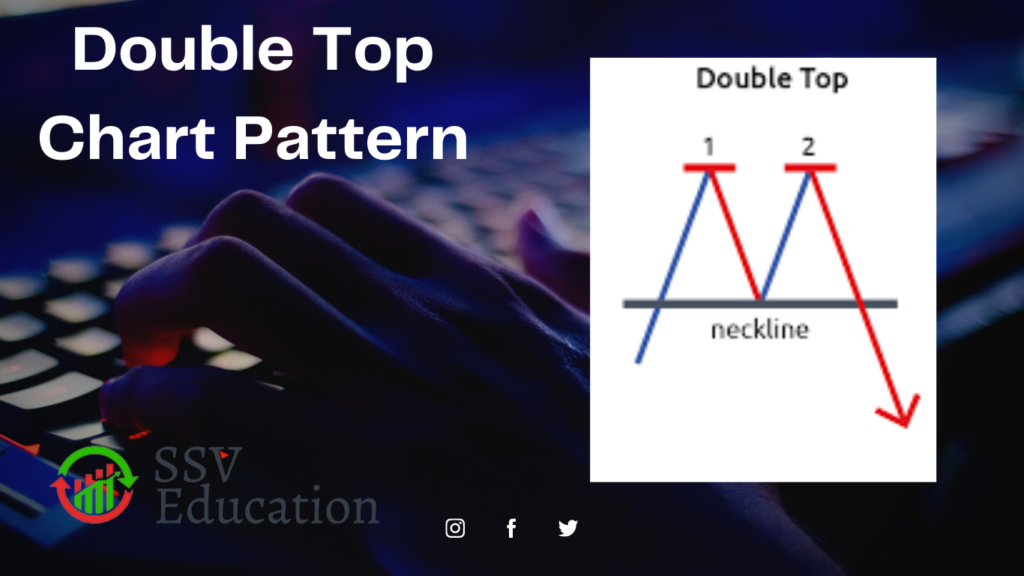
So one can trade double top pattern with clear definite signal or the aggressive one can take a trade when equal highs sees formation of equal highs and on the basis of a bearish candle formation.
Further more details with live examples are coming shortly for further understanding of the pattern in depth.
- Rounding Bottom Chart Pattern: –
The rounding bottom chart formation also comes after a down trend and it’s also a reversal chart pattern most commonly used by the traders and investors. The round bottom chart comes after making a series of lower low and lower highs on the chart pattern and slowly the candles starts forming a round bottom on the charts i.e. candles making lower lows and lowers highs starts changing the structure making higher low and lower highs further changes to making higher lows and higher highs and the pattern at some point of time looks like getting round shape which will become more clear from the below pattern chart.
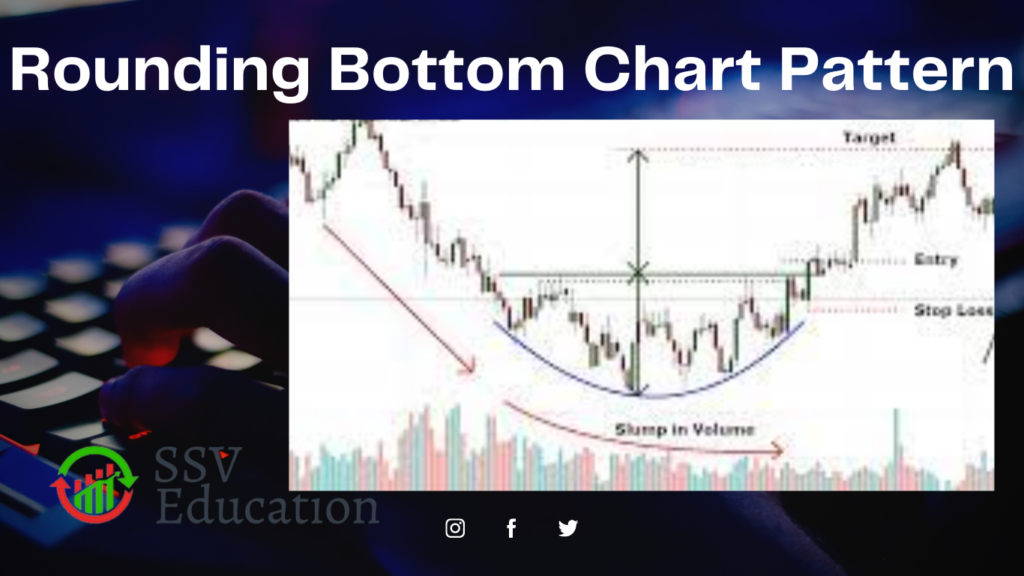
The round bottoms shows the sign of accumulation after a server downtrend and after completion of round bottom you can expect the target of the depth of bottoms. The round bottoms also traded aggressively by most of the traders when it starts forming a shape of curvature from the lowest low point to the next higher low and can also be traded after formation of complete round bottom on breakouts.
We will upload few live charts of round bottom formation in our upcoming posts.
Trend Continuation Chart Patterns
- Ascending Triangle Chart Pattern
Ascending triangle is a continuation pattern and the pattern formation is seen in an uptrend, i.e. markets making higher highs and higher lows however at some point of time you will notice that the highs are constant still the price is making higher lows. So the constant highs becomes a resistance and the higher lows line becomes keeps on moving up and finally takes a shape of triangle with fixed horizontal line and upward sloping line is termed as ascending triangle chart pattern.
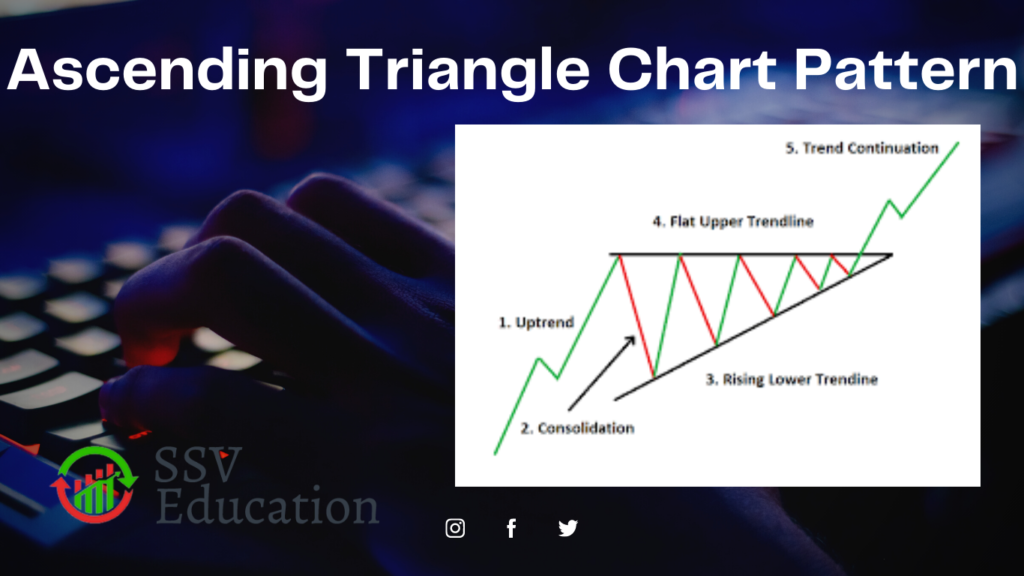
Ascending Triangle is also a strong pattern and have good success ration with excellent risk reward.
We will come out with separate post on the ascending triangle pattern with live examples to understand further in our upcoming posts.
- Flag and PoleChart Pattern
Flag and pole pattern is also a trend continuation pattern and in an uptrend you will notice that series of flag and pole patterns on price charts and the prices keep making higher highs and higher lows and at some point the price slows down and in an descending channels moves with making lower lows and lower highs (during this formation generally volumes remains very low) and forms a shape like flag and pole.
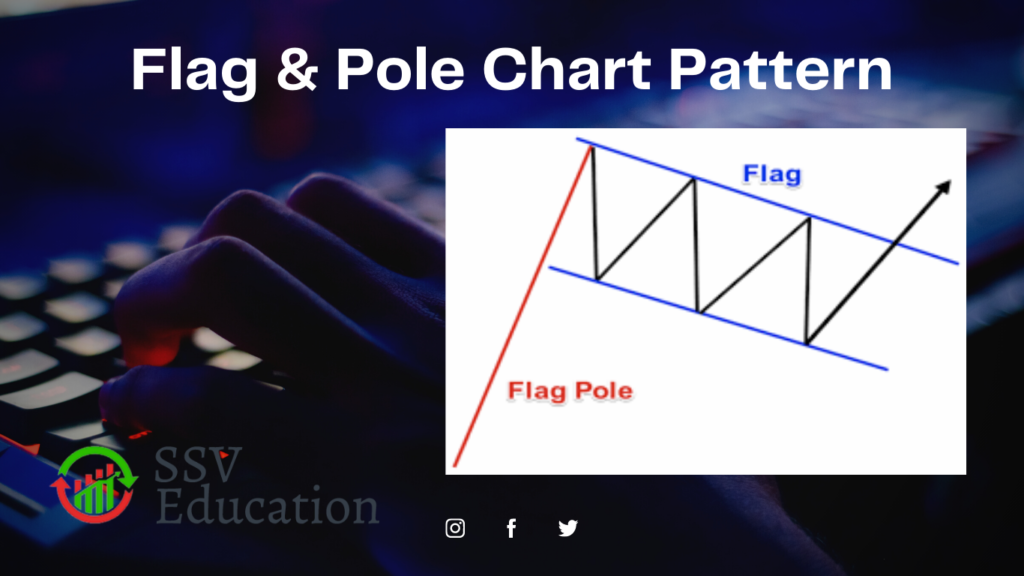
We will come out with the detailed post of flag and pole pattern with live examples shortly. As like flag and pole pattern inverse flag and pole pattern is also effective which is getting formed on the down trend and further continues the trend.
- Descending TriangleChart Pattern
As like ascending triangle chart pattern the descending triangle chart pattern is also a continuation pattern and it is getting formed during the down trend i.e. price making lower low and lower highs and at some point of time the price makes constant lows (support formation seen forming a horizontal line) and keeps on making lower highs and forms a shape of descending triangle. Once the price breaks through the horizontal line the breakout occurs from the descending triangle and the price continues the trend.
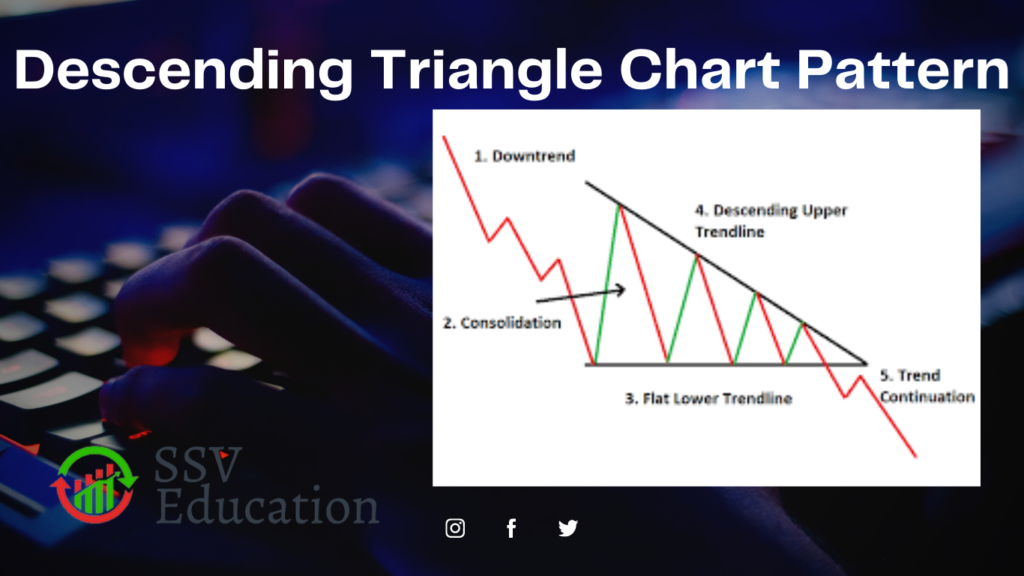
Descending triangle is also very good pattern to trades and offers a very good risk reward ratio.
We will come out with the detailed post on the descending triangle chart pattern with live examples and how to trade the descending triangle chart patterns.
- Cup and Handle Chart Pattern
Cup and handle is also a trend continuation pattern and can be seen easily on price chart patterns. Cup and handle pattern is getting formed in an uptrend at some point of time the intermediate trends turns to down trend and forms a pattern like round bottom which we have seen earlier forming a half round followed by a small half round or flag like pattern and the same looks like below

We will come out with the detailed post on the cup and handle chart pattern with live examples and how to trade the cup and handle chart patterns.
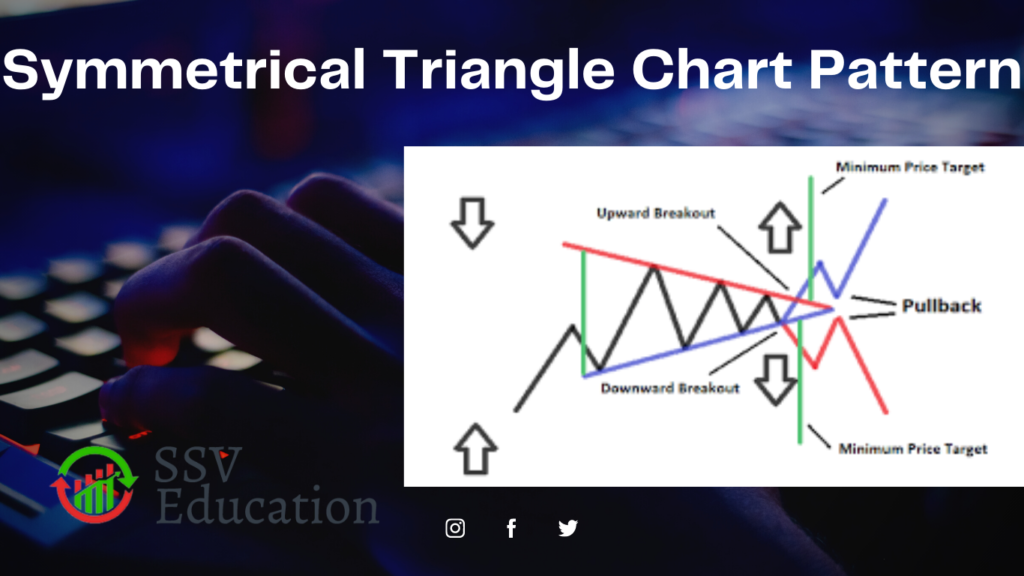
- Symmetrical Triangle Chart Pattern
Symmetrical triangle chart pattern is different from all above explained chart patterns as it acts as a continuation chart pattern as well as reversal chart pattern. Symmetrical triangles are getting formed in both uptrend and down trend i.e. bearish and bullish markets. Symmetrical triangles can either continue the prior price trend or reverses the price trend.
In a bull markets (up trend) i.e price making higher high and higher lows and at some point if you notice that the prices are making higher lows and higher highs taking a shape of symmetrical triangle one need to observe for the price breakout for understanding whether the chart will act as a continuation pattern or reversal pattern and accordingly needs to place the trades.
As like in a down trending markets also the symmetrical triangles formations seen and at times they act as a trend continuation patterns and at times trend reversal patterns.
So in this section we have seen 10 most effective technical chart patterns and those who only follow these chart patterns can definitely make huge returns.
In our upcoming post we will also discuss the wedges which forms rarely on price charts and how to trade wedges.

The contents posted here are only for Educational purpose and not a recommendation to buy or sell. Please consult your financial advisor before taking any trading or investment decision.

We have added below question that might came in your mind after going through above post
- Which time frame Is the best suitable for Trading?
- Above mentioned charts patterns suits in any time frame and results comes according to time frame.
- Whether these chart patterns works same in all time frames?
- Yes it works same in all time frames.
- Whether these chart patterns are applicable to Equity Markets Only?
- No it can be used in any markets and any time frame. i.e. Currency, Commodity, Futures and Options
- Whether any software is available for screening these chart patterns?
-Yes there are many software’s available for pattern recognition but it’s suggested to screen the chart patterns manually by looking into the charts of individual scripts which will help to gain the complete knowledge on chart patterns and also help in gaining confidence.
- How to recognize a chart pattern?
-Chart Patterns formed on price charts are easy to recognize and not required to have a exact bookish shape of a pattern. Best way to look in to 100 charts on daily basis which will boost your skill levels to the expert levels in couple of months.
- Whether one can make money out of trading the chart patterns only without looking other factors?
- Yes you can make money by trading only chart pattern, even if you master one particular chart pattern still you can keep on making money. Do not follow noise only follow patterns, no one will stop you from making money.
- Whether chart patterns fail?
-Yes chart patterns do fail and hence trading with strict stop is strongly recommended.
- What kind of risk reward these chart patterns offers?
-All above listed chart patterns offers excellent risk to reward and the failure rate in these chart patterns is low but still 40-45% times have a probability of failure.
- Whether the price pattern has any relationship with the support and resistance?
-Yes, the price patterns are getting formed out of support and resistance only.
- Whether the only above listed patterns are effective? Or any other chart patterns you suggest?
- There are many such chart patterns however; we have listed the most effective one from our experience. Wedges also can be a best tradable pattern but the same will be discussed in the different post.
- Best Books to read to understand the chart patterns?
-Encyclopedia of Chart Patterns by Thomas Bulkowski.
- Which common chart patterns are seen on forex?
-Head and Shoulders patterns & Triangle patterns are most commonly seen on forex charts and are most commonly traded.